
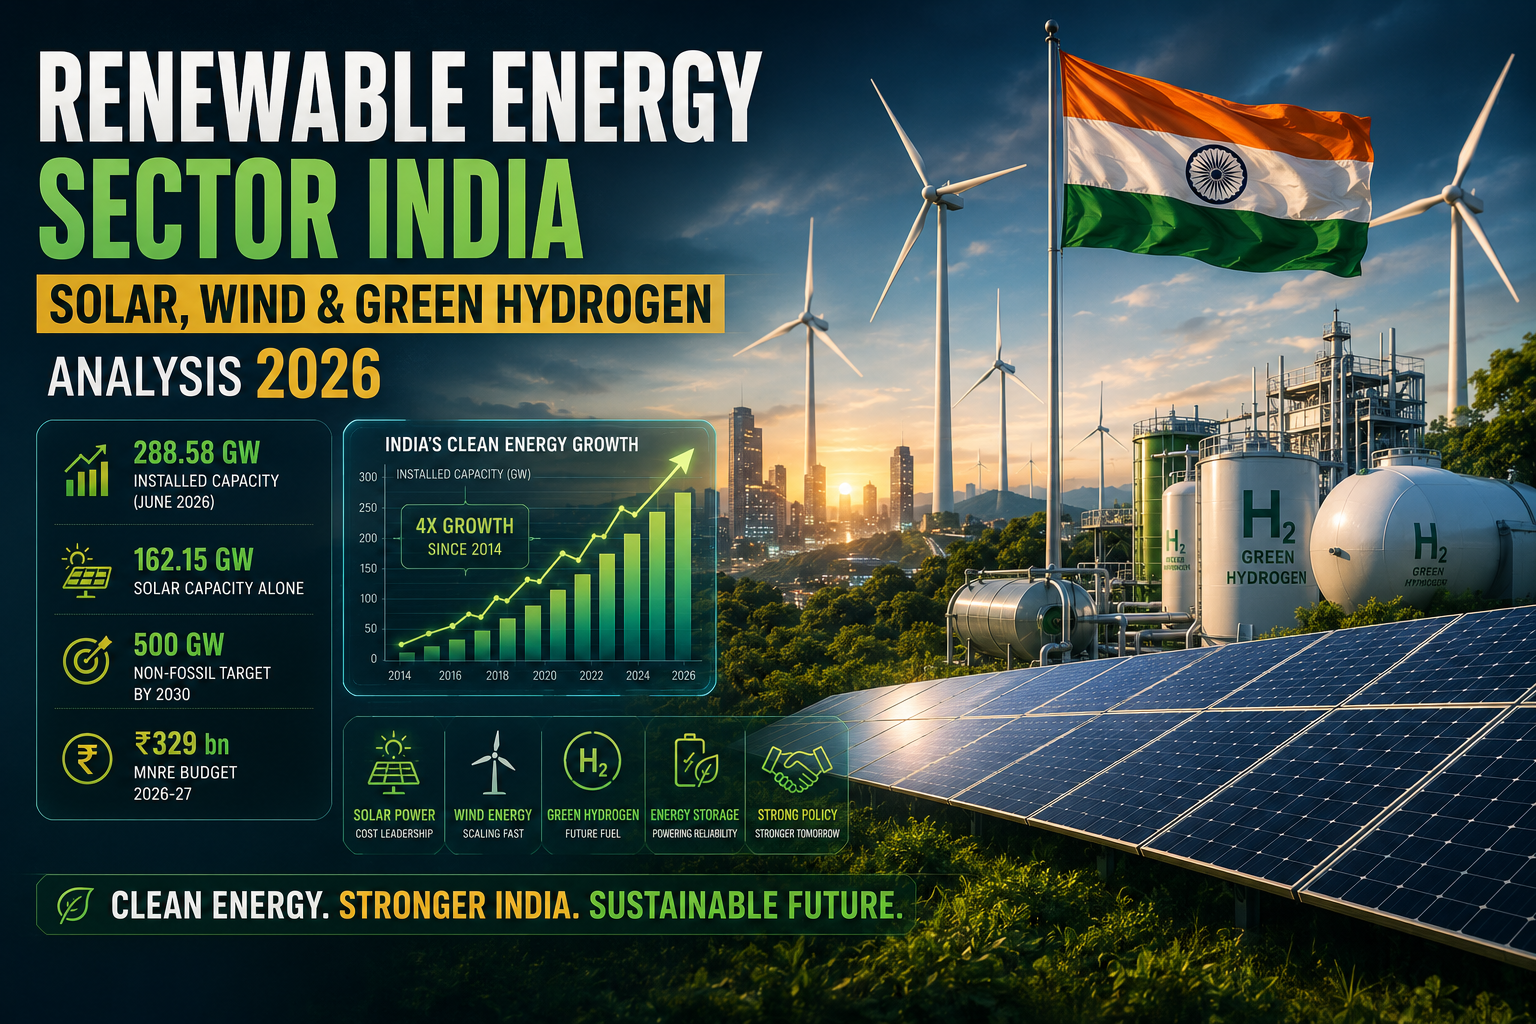

Renewable Energy Sector India: Solar, Wind & Green Hydrogen Analysis 2026
Renewable energy in India has quietly crossed a genuinely important threshold: installed capacity reached 288.58 GW by June 2026, up nearly fourfold from just 76.38 GW in 2014, with non-fossil sources now accounting for roughly 52% of India's total power capacity. This isn't a future story being pitched to investors anymore — it's a present reality with real installed megawatts, real revenue, and a policy backdrop that's arguably the most supportive it's been in five years.
We wanted to move past the generic "green energy is the future" framing and actually walk through the real capacity numbers, the falling cost curve that's making renewables genuinely cheaper than coal, and where the still-early green hydrogen opportunity fits into a realistic investment timeline.
Table of Contents
- How Fast Capacity Has Actually Grown
- Why Renewables Are Now Cheaper Than Coal
- Budget 2026: The Most Supportive Policy Environment Yet
- Solar, Wind & Hydro: Segment Breakdown
- Green Hydrogen: The Early-Stage Opportunity
- Key Players Across the Value Chain
- Real Example: Reading a Developer's Metrics
- Key Risks Worth Understanding
- How to Approach This Sector
- Frequently Asked Questions
How Fast Capacity Has Actually Grown
India's renewable capacity growth over the past decade is genuinely one of the more remarkable infrastructure build-outs globally. From 76.38 GW in 2014 to 288.58 GW by June 2026 — solar leads with 162.15 GW, followed by wind at 57.44 GW and hydropower at 57.24 GW. Total non-fossil fuel power capacity now stands at 297.36 GW, and the sector has attracted $45.72 billion in FDI between FY2014 and FY2026.
Capacity Growth Timeline
| Year | Renewable Capacity |
|---|---|
| 2014 | 76.38 GW |
| Late March 2026 | 143.60 GW solar + 55.13 GW wind |
| June 2026 | 288.58 GW total |
| 2030 Target | 500 GW non-fossil capacity |
Reaching the 500 GW target by 2030 requires adding roughly 400 GW of new capacity in just five years — an execution pace that dwarfs anything the sector has managed historically, which is exactly why understanding the policy and financing backdrop supporting this build-out matters as much as the capacity numbers themselves.
Why Renewables Are Now Cheaper Than Coal
The most underappreciated structural shift in this sector isn't policy — it's cost. Solar tariffs have fallen below ₹2.5 per unit and wind below ₹3 per unit, while new coal capacity now costs ₹4-5 per unit. Solar energy costs specifically have dropped over 85% in the past decade, a decline steep enough that renewable projects are increasingly competitive with conventional power purely on economics, independent of any climate policy consideration.
Budget 2026: The Most Supportive Policy Environment Yet
Budget 2026-27 raised the MNRE (Ministry of New and Renewable Energy) allocation to ₹329.14 billion, up from ₹265.49 billion the prior year — a genuinely significant increase. Solar specifically received ₹305.39 billion, including ₹220 billion for the PM Surya Ghar rooftop solar scheme and ₹50 billion for PM KUSUM (an agricultural solar initiative). Green hydrogen received a targeted ₹20,000 crore allocation.
Budget 2026-27 Renewable Allocation
| Program | Allocation |
|---|---|
| Total MNRE Budget | ₹329.14 billion |
| Solar (incl. PM Surya Ghar + PM KUSUM) | ₹305.39 billion |
| Green Hydrogen | ₹20,000 crore |
An analyst quote worth flagging directly: Budget 2026-27 was described as providing "the most supportive policy environment for renewable energy stocks in five years" — a meaningful characterization given how much policy volatility this sector has weathered in prior cycles. Additionally, MNRE has set a bidding trajectory of 50 GW of renewable capacity to be auctioned every year through FY2028, with at least 10 GW annually specifically reserved for wind, giving developers unusually clear forward visibility on project pipeline.
Solar, Wind & Hydro: Segment Breakdown
Solar remains the dominant segment by installed capacity and continues to benefit from the steepest cost declines, driven by both utility-scale projects and the PM Surya Ghar rooftop scheme, which has installed 26.19 lakh systems as of March 2026 against a target of one crore households by 2026-27. Wind is targeting 100 GW by 2030, up from just over 50 GW currently installed, supported by an 18+ GW domestic manufacturing capacity for turbines and components. Large hydro has grown more steadily, from 35.9 GW in 2008 to 51.16 GW by February 2026, providing the grid stability that intermittent solar and wind generation genuinely needs.
Why Hydro Matters More Than Its Headline Growth Suggests
Hydro's slower capacity growth compared to solar and wind can make it seem like the less exciting segment, but pump-storage hydro specifically plays a structurally important role as solar and wind scale — it provides grid stability by storing energy during low-demand periods and releasing it during peaks, addressing the intermittency problem that pure solar and wind capacity can't solve on their own. NHPC, as India's largest hydro PSU, sits in a genuinely different risk category than pure-play solar or wind developers precisely because of this stabilizing role, alongside a government-backed dividend yield of 3-4%.
Green Hydrogen: The Early-Stage Opportunity
Green hydrogen — produced by splitting water using renewable-sourced electricity, rather than fossil fuels — is positioned as the solution for decarbonizing genuinely hard-to-abate sectors like steel, fertilizers, and heavy transport. The National Green Hydrogen Mission carries a total outlay of ₹19,744 crore, targeting 5 million metric tonnes of annual production by 2030, alongside a separate 3 GW green hydrogen capacity target from the same window.
Green Hydrogen — Reality Check
| Factor | Status |
|---|---|
| National Mission outlay | ₹19,744 crore |
| 2030 production target | 5 MTPA |
| Current stage | Mostly pilot-scale projects |
| India's structural advantage | Abundant, low-cost solar power = potentially lowest-cost global producer |
Analyst consensus is clear on one point worth repeating directly: green hydrogen is one of India's most exciting long-term investment themes, but it genuinely requires patience, since the sector remains mostly at pilot scale today. A sensible framing many analysts suggest: don't ignore pure renewable plays (solar and wind developers) while waiting for hydrogen to mature, since companies with 17+ GW of operational renewable capacity already generate real cash flow from long-term Power Purchase Agreements (PPAs) that can fund hydrogen investments as a genuine "bonus" upside rather than the sole investment thesis.
Key Players Across the Value Chain
The renewable energy value chain spans pure-play developers (Adani Green, Suzlon), diversified utilities with renewable exposure (Tata Power, NTPC), hydro-focused PSUs (NHPC), and financing institutions (IREDA, a government-owned entity specifically funding renewable and energy-efficiency projects through loans). Each occupies a genuinely different risk-return position, similar to how we've distinguished sub-segments in our BFSI sector analysis and defense sector analysis pieces — treating "renewable energy stocks" as one undifferentiated basket misses the real risk distinctions between a pure-play developer and a diversified utility with partial renewable exposure.
Real Example: Reading a Developer's Metrics
Key Metrics Analysts Actually Use to Screen Renewable Developers
Rather than just tracking headline capacity announcements, useful screening metrics include: operational MW versus total target MW (revealing genuine execution track record, not just ambition), long-term PPA coverage above 80% of total capacity (indicating revenue certainty), debt-to-equity below 3x (critical given how capital-intensive renewable development genuinely is), and EBITDA per MW (allowing operating efficiency comparison across developers with different scales). A developer with impressive target capacity announcements but a weak operational-to-target ratio is showing ambition without proven execution — exactly the gap worth checking before assuming a large capacity pipeline translates directly into near-term earnings.
Key Risks Worth Understanding
What Could Go Wrong
1. Policy execution risk on green hydrogen and offshore wind. Regulatory frameworks for these newer segments are still being finalized, creating genuine timeline uncertainty beyond the core solar/wind story.
2. High capital intensity and leverage. Renewable development requires significant upfront capital, making debt-to-equity ratios and financing costs genuinely important risk factors, not secondary considerations.
3. Intermittency and grid integration challenges. As solar and wind scale toward 500 GW, grid stability and storage infrastructure need to scale in parallel, or curtailment risk (paying for capacity that can't be dispatched) becomes a real earnings drag.
4. Execution gap between announced and operational capacity. Ambitious capacity announcements don't automatically translate into on-schedule operational assets — checking the operational-to-target ratio, as covered above, is essential due diligence.
How to Approach This Sector

Given the genuine spread between mature, PPA-backed cash-generating operations and early-stage green hydrogen bets within the same broad sector label, a balanced approach — core exposure to established solar/wind developers with proven operational track records, alongside a smaller, patient allocation to hydrogen-adjacent names — tends to make more sense than concentrating entirely in either extreme. Small-cap green energy names specifically can be genuinely volatile, and diversification within the sector itself is worth the same discipline we've recommended for large cap vs mid cap vs small cap allocation more broadly.
Investors tracking this sector's connection to broader commodity and currency trends should also check our coverage of oil price movements, since renewable energy's relative attractiveness against fossil fuel alternatives shifts meaningfully with crude oil price trends, and our sector rotation piece for understanding how renewable energy allocation typically behaves across different phases of the broader market cycle.
For readers weighing renewable energy against other high-conviction 2026 sector themes covered on this site, our defense sector analysis and IT sector AI-led recovery analysis offer useful contrast — renewable energy's growth is driven by falling technology costs and multi-decade policy commitment, a fundamentally different and arguably more predictable driver than the AI disruption/opportunity dynamic reshaping IT, or the geopolitically-sensitive order-book cycle driving defense. This distinction matters when constructing a diversified thematic sleeve within a broader portfolio, since each sector's risk profile responds to genuinely different catalysts.
Readers building long-term SIP exposure to this theme rather than picking individual developer stocks may also find our ₹1 crore SIP calculator and mutual fund complete guide useful starting points, since several thematic ESG and renewable-focused mutual funds now offer diversified exposure across the value chain without requiring individual developer-level due diligence.
Frequently Asked Questions
How much renewable energy capacity does India have in 2026?
India's installed renewable capacity reached 288.58 GW as of June 2026, up from 76.38 GW in 2014, with solar leading at 162.15 GW, followed by wind at 57.44 GW and hydropower at 57.24 GW.
Are renewable energy costs actually lower than coal in India now?
Yes. Solar tariffs have fallen below ₹2.5 per unit and wind below ₹3 per unit, while new coal capacity costs ₹4-5 per unit, making renewables cost-competitive independent of climate policy considerations.
What is India's 2030 renewable energy target?
India targets 500 GW of non-fossil fuel capacity by 2030, requiring roughly 400 GW of new capacity additions over the following five years from the current base.
Is green hydrogen a good investment right now?
Green hydrogen remains an early-stage, mostly pilot-scale opportunity with strong long-term potential backed by a ₹19,744 crore national mission, but analysts suggest treating it as a patient, longer-horizon bet rather than a near-term growth driver.
What metrics should I check before investing in a renewable energy developer?
Key metrics include operational versus target MW (execution track record), long-term PPA coverage above 80% (revenue certainty), debt-to-equity below 3x, and EBITDA per MW for operating efficiency comparison.
What are the main risks in India's renewable energy sector?
Key risks include policy execution uncertainty on newer segments like green hydrogen and offshore wind, high capital intensity and leverage, grid integration challenges as capacity scales, and gaps between announced and operational capacity.

Pranab Barman is a Financial Educator and Personal Finance Researcher with over 10 years of hands-on experience in stock markets, trading, and investing. Currently enrolled in the CFA Program, he is committed to continuous learning and professional excellence in finance.
As the Founder of PlayWithStock, Pranab covers a wide range of topics including Mutual Funds, SIP, Taxation, Stock Market Basics, and Financial Calculators — with a focus on simplifying complex financial concepts for everyday all investors.
Email: support@playwithstock.com
Website: playwithstock.com
Related posts:
 Stocks to Buy After India-US Trade Deal 2026: A Sector-by-Sector Breakdown
 Semiconductor Sector India: Complete Analysis 2026
 Pharma Sector Analysis India 2026: Export Growth & US Tariff Impact
 PSU Bank Stocks Sector Analysis: Why They Outperformed in 2025-26
 What Is Sector Rotation? A Simple Guide for Indian Investors
 AI Investing 2026: The Complete India-US Stock Guide
 Best AI Stocks India 2026: 7 Picks That Are Actually Worth Watching
 Today Nifty India Market Outlook: Oil, Rupee, VIX and FII Selling Explained