


The Imported Fall: Why Dalal Street Is Bleeding for Reasons That Aren't Even Indian

The Imported Fall: Why Dalal Street Is Bleeding for Reasons That Aren't Even Indian
Published: Sep 29, 2026 | Updated: Sep 29, 2026 | Reading time: 22 min
On Monday, September 28, 2026, the Sensex slid to an intraday low of about 72,855 and the Nifty 50 touched roughly 22,819, both down around 1.4% on the day, after the Nifty had already ended the previous week with its seventh weekly decline in a row. Anyone who opened a business news app that morning was greeted with an explanation that read almost like a foreign-language bulletin: Brent crude above $100, a US Treasury yield above 5%, a rupee near record lows, and rising Iran-US tensions. Look closely at that list and something odd stands out. Almost none of those forces were born inside an Indian boardroom, an Indian regulator's office, or an Indian company's quarterly report. This is what we call the imported fall: a decline in Indian share prices that is driven mainly by events, prices and policies set outside India, and then transmitted into Dalal Street through oil, currency and foreign money flows.
Understanding the imported fall matters because it changes what a reasonable investor should worry about, and what they can safely ignore. A market that falls because its companies are earning less needs one kind of response. A market that falls because a barrel of oil got expensive and a US bond got more rewarding needs a very different one. In this guide, we trace the four channels through which the imported fall reaches your portfolio, look at the real numbers behind each one, test where the "it's all imported" story is too simple, and list the signals worth watching next. If you are new to how markets work, start with our primer on what the stock market is and how it works, and if you want historical context for market declines, our article on the biggest stock market crashes in history is a good companion read.
Table of Contents
- What Exactly Is an "Imported Fall"?
- The Scoreboard: Where the Indian Stock Market Fall Stands Today
- Channel One: Crude Oil and the Imported Fall
- Channel Two: The US Yield Above 5%
- Channel Three: The Rupee at Record Lows
- Channel Four: FPI Selling, the Transmission Belt
- Who Is Holding the Market Up? The DII and SIP Cushion
- Sector Map: Who Bleeds and Who Holds in an Imported Fall
- Where the Imported Fall Story Is Too Simple
- Imported Falls of the Past: 2013, 2018, 2022 and Now
- Five Signals That Would Change the Story
- What Retail Investors Can Sensibly Do
- Final Thoughts
- Frequently Asked Questions
What Exactly Is an "Imported Fall"?
An imported fall is a market decline whose main cause sits outside the country where the market trades. The term is not an official financial definition, so it is worth being precise about how we use it here. An imported fall has three features. First, the trigger is external: a jump in global crude prices, a rise in US interest rates or bond yields, a geopolitical shock, or a sharp move in the dollar. Second, the transmission is mechanical: the external shock reaches Indian stocks through identifiable channels such as the import bill, the rupee and foreign portfolio flows, rather than through a change in what Indian companies actually earn from their customers. Third, the fall is broad: when the cause is global money moving, most stocks fall together, including good businesses with healthy balance sheets, which is exactly what the sell-off on September 28 looked like, with the Nifty Midcap 100 and Smallcap 100 both sliding by more than 1% alongside the large caps.
The opposite of an imported fall is a domestic fall, where the trigger is inside the country: a slowdown in corporate earnings, a banking stress event, a policy shock, or a scandal at a major company. Real markets are usually a mix of the two, and later in this article we look at where the domestic part of the picture still matters. But in the current Indian stock market fall, market participants have been unusually direct about the balance. One widely repeated summary from fund managers described the September selling as "a crude-and-dollar story, not an India story", as reported by The Financial Economy.
The Scoreboard: Where the Indian Stock Market Fall Stands Today
Before explaining the causes, it helps to see the damage in numbers. The table below pulls together the key readings from late September 2026, using figures reported by INDmoney, Outlook Money and other market reports. Figures move daily, so treat this as a snapshot rather than a live feed.
Market Snapshot: Late September 2026
| Indicator | Reading | What It Tells Us |
|---|---|---|
| Nifty 50 close, Sep 25 | 23,140.50 | Seventh weekly decline in a row |
| Nifty 50 intraday low, Sep 28 | ~22,819 | Down about 1.4% on the day |
| Sensex intraday low, Sep 28 | ~72,855 | Down roughly 1,040 points on the day |
| Nifty Midcap 100, Sep 28 | About −1.25% | Broad-based, not only large caps |
| Nifty Smallcap 100, Sep 28 | About −1.32% | Risk appetite falling across the board |
| Brent crude, Sep 22 (spot) | $114.89 | Up about 28% from $89.75 on Aug 28 |
| US 10-year yield, Sep 25 | 5.17% | Up from 4.96% on Sep 22 |
| Rupee, late September | ~95.8–96 per dollar | Record-low territory |
Notice how many rows on that table are not Indian numbers at all. Three of the eight readings, crude, the US yield and the dollar-rupee rate, are set in global markets. That ratio is the imported fall in one glance.
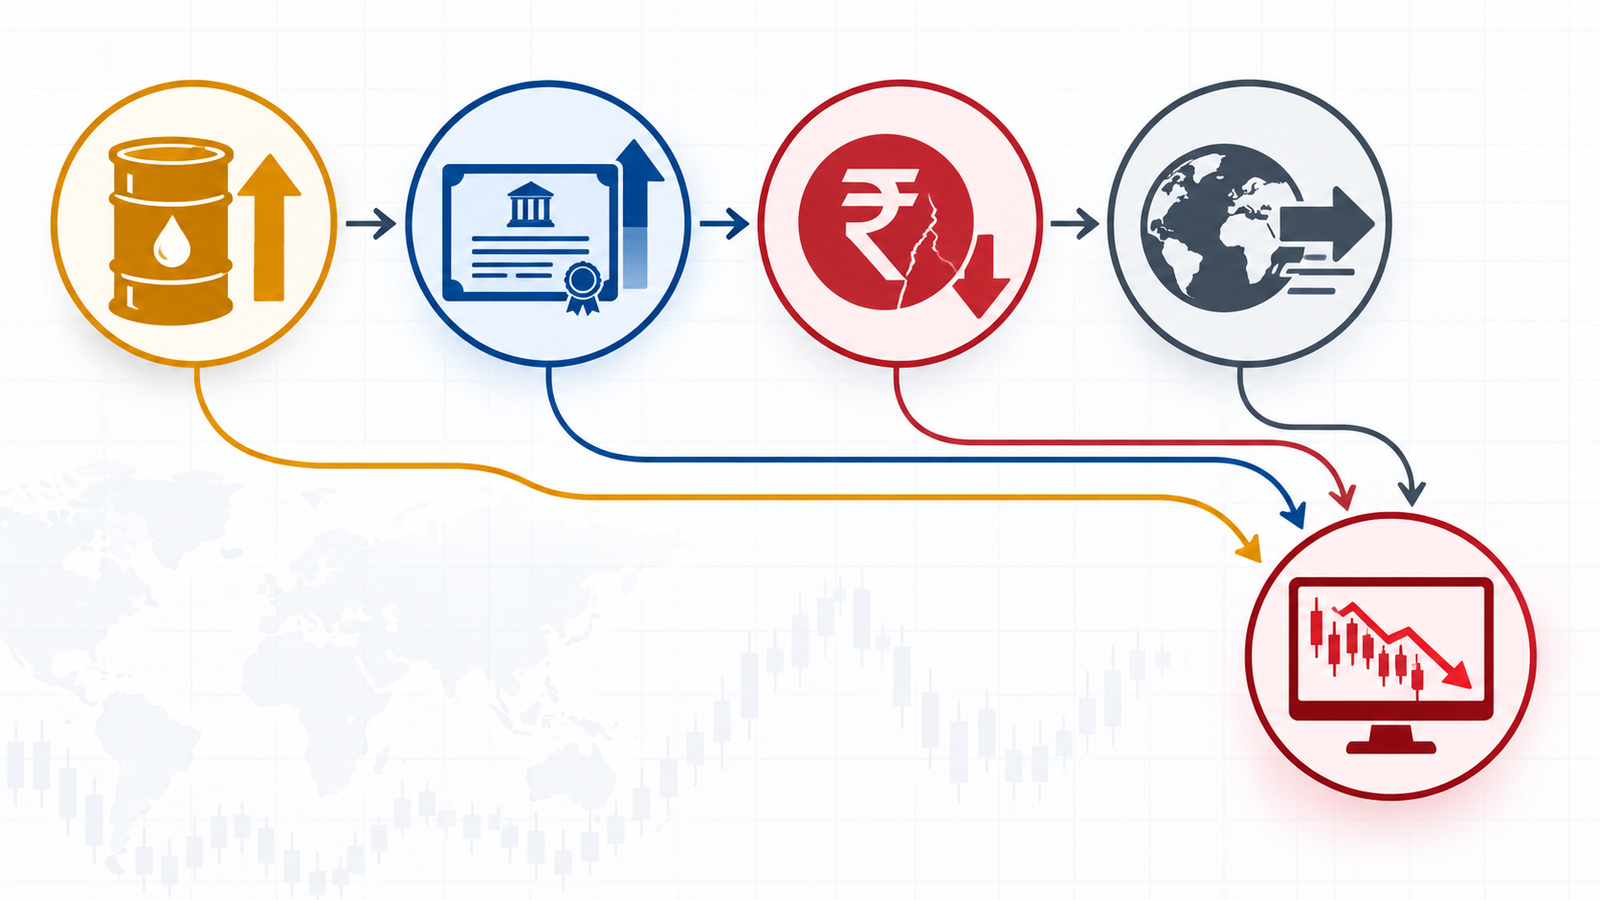
Channel One: Crude Oil and the Imported Fall
India imports the large majority of the crude oil it consumes, which makes the price of Brent crude one of the most important external numbers for the Indian economy. When oil rises sharply, a chain of consequences follows, and each link in that chain touches the stock market.
The first link is simple arithmetic. Oil is priced in dollars, so a higher Brent price means India has to spend more dollars to buy the same quantity. That widens the trade gap and, over time, the current account deficit. More dollars flowing out means more demand for dollars against the rupee, and the rupee tends to weaken. A weaker rupee makes imports costlier still, which feeds inflation. Higher inflation can push the Reserve Bank of India towards a tighter stance, which is unwelcome news for borrowers, for banks' bond portfolios, and for share valuations.
The recent oil move has been sharp. According to US Energy Information Administration data cited in market coverage, Brent spot crude stood at about $89.75 a barrel on August 28 and climbed to $114.89 on September 22. By the morning of September 28, futures had eased back from that spike but still hovered around $106-107, leaving oil firmly above $100. And this is not the first spike of 2026: reports from late April described Brent touching roughly $126, a level not seen since June 2022, at a time when the rupee was also setting record lows. Oil, in other words, has been a recurring pressure point for Indian markets all year.
One useful nuance from the coverage is the difference between energy availability and energy price. Earlier in the year, the government said India held about 60 days of crude rolling stock, which speaks to supply security. The stock market's current worry is not that India will run out of oil; it is the price India must pay for it. Availability risk is a physical problem. Price risk is a financial problem, and financial problems show up on a Sensex screen within minutes. For a deeper look at how commodity shocks ripple through equities in general, you can revisit the lessons in our guide to how to diversify your stock portfolio.
Channel Two: The US Yield Above 5%
The second channel is less visible to ordinary investors but arguably more powerful: the return on the safest asset in the world. When the yield on the US 10-year Treasury rises above 5%, a dollar-based investor can earn more than 5% a year from a government security with, for practical purposes, no default risk. Every risky asset in the world, including Indian equities, must then justify why it deserves money instead.
Official US Treasury data show the 10-year yield moving from 4.96% on September 22 to 5.11% on September 23, 5.18% on September 24 and 5.17% on September 25. That is a rise of more than 20 basis points in just three sessions, which is a large move for a benchmark that usually changes slowly. Alongside it, reports indicate the US Federal Reserve's policy rate now sits in a range of 3.75% to 4.00%, which has narrowed the gap between US and Indian returns and made Indian assets look less generous to global allocators.
Why does this matter for a stock in Mumbai? Because of a concept finance professionals call the equity risk premium: the extra return investors demand for owning shares instead of risk-free bonds. When the risk-free rate climbs, the premium shrinks unless share prices fall or earnings expectations rise. A global fund manager deciding whether to hold Indian equities is effectively comparing two numbers: what Indian stocks might earn, adjusted for currency risk, and what a US Treasury pays for certain. When the second number jumps, the comparison shifts, and money moves.
A Simple Illustration (Not a Forecast)
Imagine a global fund that expects 12% a year from Indian equities in dollar terms. When US government bonds yield 4%, the extra reward for taking equity risk is 8 percentage points. When bonds yield above 5%, that cushion falls to roughly 7 points or less, even though nothing changed about Indian companies. Some funds will decide the smaller cushion is no longer worth the volatility and trim their India holdings. Multiply that decision across thousands of funds and you have a meaningful sell-off. This is a hypothetical example, meant only to show the logic.
Channel Three: The Rupee at Record Lows
The third channel is the currency, and it works in two directions at once. First, a weaker rupee raises the cost of imports, including oil, which feeds back into inflation and the deficit. Second, a weaker rupee directly reduces the returns of foreign investors, because they measure profits in dollars. A share that rises 5% in rupee terms delivers less than 5% to a foreign fund if the rupee falls 1% over the same period.
The rupee's slide in 2026 has been steady and, at moments, sharp. Coverage from March 2026 described an all-time low of about 94.82 against the dollar amid the West Asia conflict and heavy foreign outflows. By the end of April, the currency had touched a fresh record of roughly 95.32 as Brent surged towards $126. In September, the rupee hit a new low around 95.92-95.96 and briefly breached 96 during the day, after its sharpest weekly decline in four months, a fall of about 1.1%. By the close of trading on Friday, September 25, it was hovering near 95.81.
The Rupee's Record-Low Timeline in 2026
| Period | Approximate Level (₹ per US$) | Main Backdrop |
|---|---|---|
| March 2026 | ~94.82 (then a record) | West Asia conflict, heavy dollar demand |
| Late April 2026 | ~95.32 (new record) | Brent near $126, record FII selling |
| Mid-September 2026 | ~95.92-95.96, breached 96 intraday | US yields above 5%, oil above $100 |
| Sep 25, 2026 close | ~95.81 | Seventh weekly Nifty fall |
Market commentary has described the currency as caught in a feedback loop: higher oil raises dollar demand from importers, foreign selling adds to the pressure, and each factor strengthens the other. The Reserve Bank of India has tools to manage volatility, and its October policy meeting is being watched closely for signals. You can follow official statements directly on the Reserve Bank of India website. But no central bank can fully offset a global move in oil and yields, which is why the rupee is best understood as a transmission belt for the imported fall rather than its original cause.
Channel Four: FPI Selling, the Transmission Belt
Foreign portfolio investors, or FPIs, are the delivery mechanism that turns the first three channels into falling share prices. When oil is expensive, US yields are high and the rupee is weak, the rational move for a global fund is often to trim exposure, and the data show that is what has been happening.
According to reports based on depository data, FPIs have withdrawn about ₹2.45 lakh crore from Indian equities so far in 2026, which already exceeds the ₹1.66 lakh crore withdrawn during all of 2025. For perspective, earlier coverage had described about ₹1.2 trillion of FPI selling in 2022 as a record at that time, which means 2026's outflow is now roughly double that benchmark. The monthly pattern is revealing: after heavy selling from March to June, foreign investors returned as net buyers in July and August, before turning sellers again in September.
*September figure is net outflow through Sep 27 per depository data; other trackers with earlier cut-off dates reported ₹20,974 crore to Sep 18 and ₹23,676 crore to Sep 19. March to June figures are rounded from reported totals. Sources: Business Standard, Multibagg, The Financial Economy.
Look closely at the September number. Depository data show exchange selling of about ₹25,682 crore, partly offset by roughly ₹8,551 crore of foreign money going into IPOs in the primary market, which leaves a net outflow of ₹17,131 crore. That detail is important: foreign investors are still willing to buy new Indian listings, which is not what a story about deep distrust of India would look like. It is what a story about global risk budgets tightening would look like. Sector data for January to August also show financial services as the largest drag, with net outflows crossing ₹1 lakh crore, a fact we return to in the section on where the imported fall story is too simple.
Who Is Holding the Market Up? The DII and SIP Cushion
If foreign investors are selling in size and the market is falling steadily rather than collapsing outright, someone must be absorbing that supply. That someone is domestic institutions. Provisional data show domestic institutional investors, mainly mutual funds fed by monthly SIP contributions, bought about ₹52,617 crore in the cash market between September 1 and September 25.
That number is more than double the net foreign selling in the same month, and it describes one of the biggest structural changes in Indian markets over the past decade. Foreign selling used to face far less domestic buying to offset it. Today, millions of retail investors contribute to systematic investment plans every month regardless of headlines, which creates a steady base of domestic demand. Our guide on SIP in stocks versus SIP in mutual funds explains how these plans work, and how to invest in index funds covers the passive route many SIP investors take.
Why the DII Cushion Matters
- It slows the fall: domestic buying absorbs a large share of foreign selling, so declines are less violent than the outflow numbers alone would suggest.
- It is not unlimited: SIP inflows depend on household incomes and confidence; a long fall can test both.
- It changes who owns the market: a rising domestic share means Indian households, not only global funds, increasingly set the price of Indian companies over time.
Sector Map: Who Bleeds and Who Holds in an Imported Fall
An imported fall does not hit every industry equally, even when index-level numbers are all red. Because the transmission channels are oil, the rupee and rates, different sectors sit on different sides of each one. The table below shows the general tendency for each group under the current mix of expensive oil, high US yields and a weak rupee. It is a framework for thinking, not a prediction for any individual stock, and company-specific factors can override any of these tendencies.
| Sector | General Tendency | Why (In One Line) |
|---|---|---|
| Aviation | Under pressure | Fuel is a large cost and many costs are dollar-linked |
| Paints, tyres, chemicals | Under pressure | Crude-linked raw materials squeeze margins |
| Oil marketing companies | Under pressure | Higher input costs versus regulated or sticky retail prices |
| Banks and NBFCs | Under pressure | Rate worries and the largest foreign outflows by sector in 2026 |
| Upstream oil producers | Relatively supported | Higher realisations on the crude they sell |
| IT services exporters | Relatively supported | Dollar revenues gain from a weaker rupee |
| Pharma exporters | Relatively supported | Export earnings benefit from a weaker rupee |
| FMCG | Mixed | Defensive demand, but input-cost pressure from crude derivatives |
| Power and utilities | Mixed | Domestic demand stable, but fuel and rate sensitivity vary |
Two lessons come out of this map. First, the imported fall is not one event for every stock; it is a redistribution, with some businesses genuinely helped by the same forces that hurt others. Second, this is why a diversified portfolio behaves differently from a concentrated one during external shocks. If you want to see how the country's largest companies are spread across these sectors, our ranking of India's top 10 most valuable companies in 2026 shows how heavily banking and financials weigh on the index, which helps explain why the sector-level outflows above matter so much for the headline numbers.
Where the Imported Fall Story Is Too Simple
An honest analysis has to test its own thesis. The idea that the Indian stock market fall is entirely imported is comforting, but it is not the whole truth, and treating it as such could lead investors to underestimate real risks.
Four Reasons "It's All Imported" Can Mislead
- Valuations were already high: a market priced for smooth conditions is more sensitive to any external shock. The shock is imported, but the vulnerability may be domestic.
- Financials led the outflows: foreign selling has been heaviest in financial services, which are a large part of the index. That may reflect sector-specific concerns as well as global risk-off behaviour.
- Persistent oil dependence is a domestic choice: India's exposure to crude is structural. The shock arrives from abroad, but the sensitivity is a feature of the Indian economy.
- Earnings can still disappoint: if higher input costs and a weaker consumer squeeze company profits over the coming quarters, an imported fall can become a domestic one.
The most careful framing is that the trigger is imported while the transmission and the sensitivity are partly domestic. Fund managers describing September as a macro story rather than a judgement on Indian businesses are probably right about the trigger. Whether it stays that way depends on what happens to company earnings in the quarters ahead, and that is a question the numbers have not yet answered. For a framework on reading company results yourself, see our guide on how to read a company balance sheet.
Imported Falls of the Past: 2013, 2018, 2022 and Now
India has been through externally driven declines before, and each episode had its own flavour. Looking at them side by side helps separate what is genuinely new about 2026 from what is a familiar pattern. The table below is a broad-brush comparison meant as context, not a forecast; no two episodes are identical.
| Episode | External Trigger | What Hit India |
|---|---|---|
| 2013 "taper tantrum" | US signals reduced bond buying, global yields jump | Sharp rupee slide to the high 60s per dollar, bond and equity outflows |
| 2018 oil and rupee stress | Brent climbs to the mid-$80s, dollar strengthens | Rupee crosses 74 per dollar; domestic credit stress adds to the fall |
| 2022 rate-hike cycle | Aggressive Fed tightening, strong dollar | Record FPI selling of about ₹1.2 trillion at the time |
| 2026 so far | Oil above $100, US 10-year above 5%, West Asia and Iran-US tensions | FPI selling of ₹2.45 lakh crore, rupee near ₹96, seven weekly Nifty declines |
Three patterns stand out. First, imported falls tend to arrive as a combination of oil, dollar and rates rather than a single cause, which is exactly the cocktail of 2026. Second, they often overlap with a domestic weak spot, as in 2018 when credit stress at home compounded the external pressure. Third, they tend to end when the external variables stop worsening, not necessarily when they reverse; markets often stabilise once oil stops rising, yields stop climbing and the rupee finds a floor. For a wider look at how sharp declines have unfolded across markets, our article on the biggest stock market crashes in history gives global context, and the piece on AI-driven algorithmic trading explains how automated strategies can amplify these moves within a session.

Five Signals That Would Change the Story
Because the imported fall is driven by external variables, the most useful thing an investor can do is watch those variables instead of the index alone. Five signals deserve attention.
Your Imported-Fall Watchlist
- Brent crude: a sustained move back below $100, and especially a fading of the geopolitical premium, would ease the first and most important channel.
- US 10-year yield: a retreat below 5% would reduce the pull of safe dollar returns; you can track it on the US Treasury website.
- The rupee near 96: analysts have flagged that a clean break beyond that level could extend foreign selling, while stabilisation would calm one of the biggest FPI worries.
- FPI flows: a return to net buying, as seen in July and August, would show that global appetite for India is intact.
- RBI's October policy: the central bank's tone on rates and the rupee can either steady sentiment or add to rate pressure on banks.
Short-term volatility also has a calendar. The monthly derivatives expiry on September 29 typically brings choppier trade as positions roll over, which can exaggerate moves in either direction regardless of fundamentals. Understanding that some of the day-to-day noise is mechanical helps separate expiry-week volatility from the deeper external story. For exchange data and official market notices, the NSE India and BSE India sites are the primary sources, and the SEBI website carries regulatory updates.
What Retail Investors Can Sensibly Do
The following points are educational, not personal investment advice, because the right response depends on your goals, time horizon and finances. But some principles hold across most situations.
Separate the cause from your plan. If your investing plan was built around a ten- or fifteen-year horizon, an imported fall driven by oil and yields is a reason to review your assumptions, not automatically a reason to abandon them. If you need the money within a year or two, the risk you are carrying may be too high regardless of the cause. Time horizon, not the headline, is the deciding variable.
Understand what you own. Because an imported fall redistributes pain unevenly across sectors, it exposes concentration. A portfolio heavy in banks, aviation or crude-sensitive manufacturers will feel this environment very differently from one heavy in exporters. Reviewing your sector exposure is a practical exercise, and our guide on diversifying your stock portfolio walks through it.
Be careful with leverage and expiry-week trading. Volatile, externally driven markets are the environment in which borrowed money causes the most damage. Positions that look safe on a calm day can be forced out on a day when oil or yields jump overnight.
Keep your emergency fund separate. The single most reliable way to avoid selling investments at a bad time is not needing to. A cash buffer outside the market protects long-term holdings from short-term shocks. If you are comparing ways to hold different kinds of exposure, our explainers on Nifty 50 versus Sensex, dividend investing and blue chip stocks in India are good places to build understanding, and common mistakes new investors make lists the behaviours most worth avoiding.
Resist predicting the bottom. No one, including professional strategists, can reliably call the end of an externally driven decline. What can be done is to prepare: know your plan, know your exposure and know which signals would change your view. That is a more useful skill than trying to guess Monday's close.
Final Thoughts
The imported fall is a useful lens because it moves the question from "what is wrong with India?" to "what is changing around India?" On the evidence available in late September 2026, the answer is that oil has spiked, US yields have climbed above 5%, the rupee has weakened to record lows and foreign investors have responded by selling, while domestic investors have absorbed a large part of that selling through steady SIP-driven buying. Those are external forces working through well-understood channels.
Yet the lens has limits. India's sensitivity to oil is structural, valuations were not cheap, financial stocks have seen outsized outflows, and earnings in the coming quarters will show whether an imported shock stays imported. The wisest posture is neither panic nor complacency. It is to watch the five external signals, understand your own exposure and remember that every previous imported fall, from 2013 to 2022, eventually gave way to a different set of conditions. Markets change their story regularly, and the investors who do best are usually the ones who understood which story they were in.
Frequently Asked Questions
1. What does "imported fall" mean in the stock market?
An imported fall is a decline in a country's stock market caused mainly by external factors such as global oil prices, foreign interest rates, geopolitical tension and currency moves, rather than by weaker domestic company earnings. The external shock reaches local shares through channels like the import bill, the exchange rate and foreign portfolio flows.
2. Why does higher crude oil make Indian stocks fall?
India imports most of its oil, so higher prices raise the import bill, widen the current account deficit, weaken the rupee and push up inflation. Together these pressures can reduce company margins, raise interest-rate worries and encourage foreign investors to sell Indian equities.
3. How does the US Treasury yield affect the Sensex and Nifty?
When US yields rise, a risk-free dollar investment becomes more rewarding, which reduces the relative appeal of riskier assets like Indian shares. Global funds may shift money out of emerging markets towards US bonds, and that selling shows up in Indian indices.
4. Why does a weaker rupee matter to foreign investors?
Foreign investors measure returns in their own currency, usually the dollar. If the rupee falls while they hold Indian shares, part of their gains is erased by currency loss, which makes Indian equities less attractive and can prompt further selling.
5. How much have foreign investors sold in Indian equities in 2026?
Reports based on depository data put net FPI selling in Indian equities at about ₹2.45 lakh crore so far in 2026, which is more than the ₹1.66 lakh crore withdrawn during the whole of 2025. Foreign investors were net buyers in July and August before turning sellers again in September.
6. Who is buying Indian stocks while foreign investors sell?
Domestic institutional investors, particularly mutual funds receiving monthly SIP contributions, have been the main buyers. Provisional data show they bought roughly ₹52,617 crore in the cash market between September 1 and September 25, cushioning the impact of foreign selling.
7. Is the current fall entirely caused by external factors?
No. The trigger is largely external, but domestic elements still matter, including high starting valuations, India's structural oil dependence, sector-specific outflows from financial stocks and the possibility that higher costs eventually weigh on company earnings.
8. Which sectors tend to benefit when the rupee weakens and oil is high?
Export-oriented businesses such as IT services and pharma exporters generally gain from a weaker rupee, and upstream oil producers can benefit from higher crude realisations. Fuel-heavy or crude-linked sectors like aviation, paints and tyres tend to be under pressure. These are general tendencies, and individual companies can differ.
9. Should I stop my SIP during an imported fall?
That depends on your goals and finances, and this article is not personal advice. Generally, SIPs are designed to continue through market cycles, and the amount you can comfortably sustain matters more than the headlines. If your income or emergency fund is under stress, review your plan with a qualified financial advisor.
10. How long could an imported fall last?
No one can predict this reliably. Externally driven declines have tended to ease when the pressure points stop worsening, meaning oil stops climbing, yields stabilise and the currency finds a floor. Watching those variables is more informative than guessing a date.
For further reading on related topics covered on this site, see our guides on Tata vs Reliance vs Adani vs Birla, India's top 10 most valuable companies in 2026, algorithmic trading regulations: SEBI vs SEC, what market capitalization really means, and large-cap stocks to watch in 2026.
Disclaimer: This article is for educational purposes only and is not investment, tax or legal advice. Market figures are drawn from public reports as of late September 2026, change daily and may differ across data providers. Please verify current numbers and consult a SEBI-registered advisor before making investment decisions.

Pranab Barman is a Financial Educator and Personal Finance Researcher with over 10 years of hands-on experience in stock markets, trading, and investing. Currently enrolled in the CFA Program, he is committed to continuous learning and professional excellence in finance.
As the Founder of PlayWithStock, Pranab covers a wide range of topics including Mutual Funds, SIP, Taxation, Stock Market Basics, and Financial Calculators — with a focus on simplifying complex financial concepts for everyday all investors.
Email: support@playwithstock.com
Website: playwithstock.com
Related posts:
 Sensex Nifty Crash July 2026: 3 Real Reasons Behind the Fall
 SK Hynix IPO: Massive $26.5B Debut Shocks Wall Street
 Sensex-Nifty Tumble Today: Why Crude Oil & Middle East Tensions Are Rattling Indian Markets
 Rupee vs Dollar July 2026: 5 Shocking Reasons the Rupee Is Falling
 Nifty July Seasonality: Why July Is Nifty’s Strongest Month (27-Year Data)
 AI-Driven Algorithmic Trading: How Hedge Funds Beat the Market
 FII vs DII: 7 Key Differences Every Indian Investor Should Know
 Trump Just Gave Indian Pharma a Two-Year Countdown Clock — Here’s What the US Generic Drug Tariff Actually Means