
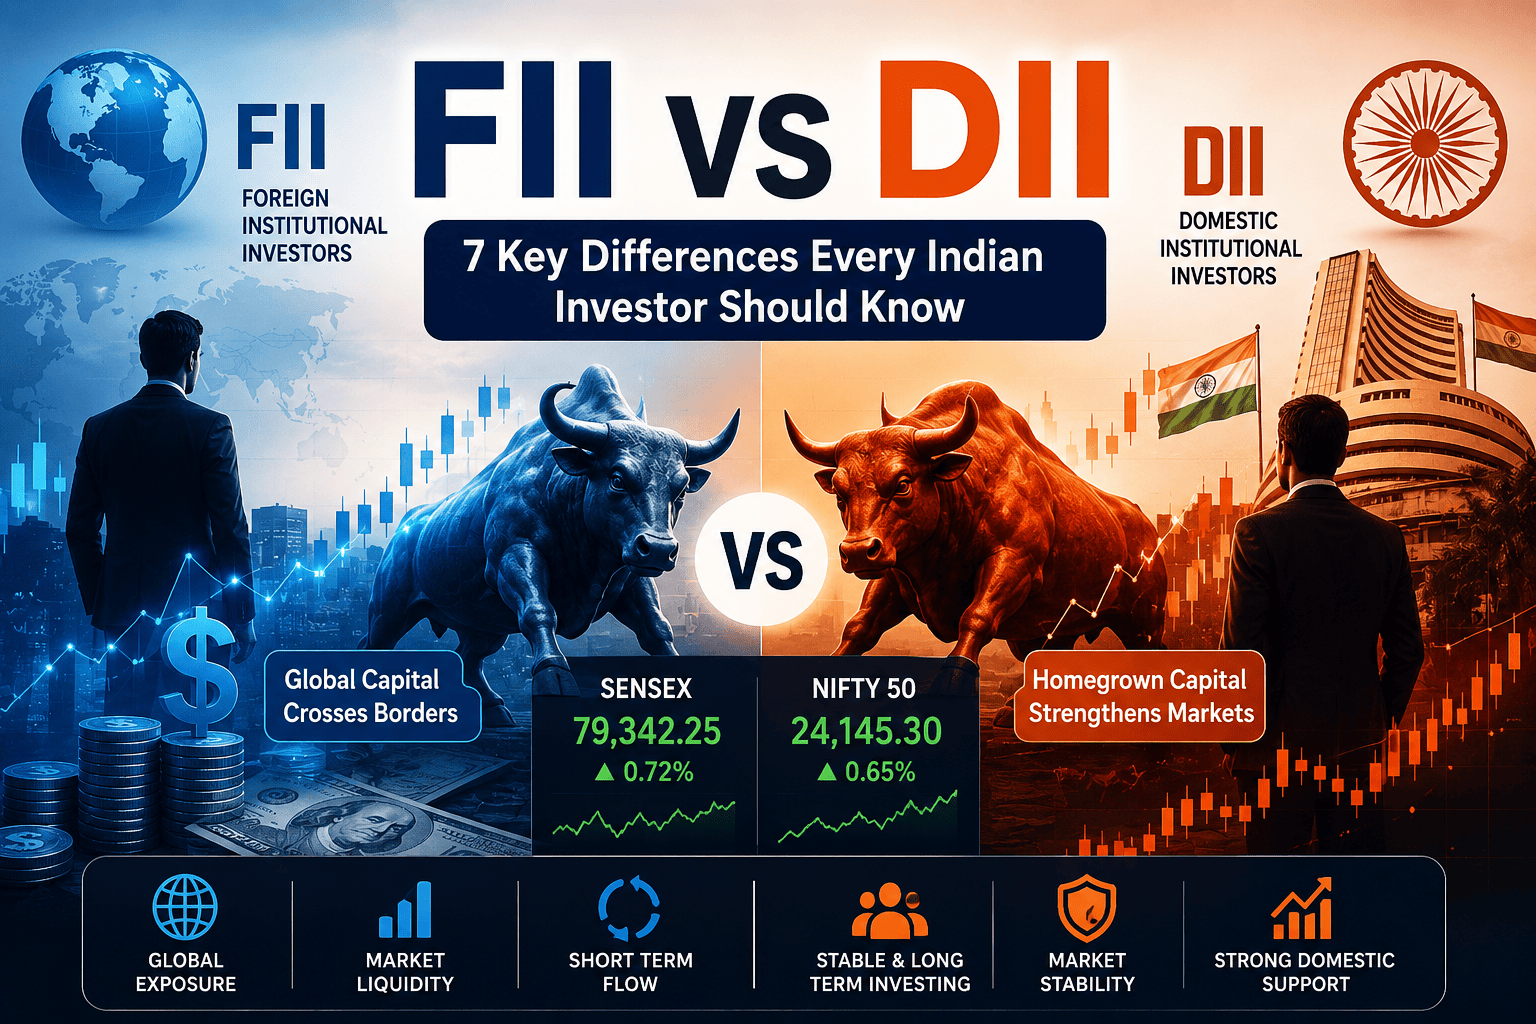

FII vs DII: 7 Key Differences Every Indian Investor Should Know
Two letters keep showing up on every market news headline. Here's exactly what FII and DII mean, how they move Nifty and Sensex, and why watching their daily numbers can genuinely make you a better investor.
- 1. FII vs DII: The Basic Definitions
- 2. What Exactly Is an FII
- 3. What Exactly Is a DII
- 4. FII vs DII: 7 Key Differences
- 5. How FII vs DII Data Actually Moves the Market
- 6. How to Read FII/DII Data Like a Professional
- 7. A Real Example: What Happened This Week
- 8. Common Mistakes Retail Investors Make
- 9. FAQs
FII vs DII is one of the first acronym pairs every new Indian stock market investor runs into, usually on a business news ticker or in a broker's daily report. Foreign Institutional Investors and Domestic Institutional Investors are the two biggest forces moving money in and out of Indian equities every single trading day, and understanding the FII vs DII dynamic is genuinely one of the higher-leverage things a retail investor can learn — not because you should trade on their numbers blindly, but because it explains why the market sometimes shrugs off bad news, or falls despite good news.
⚡ FII vs DII — Quick Reference
| FII Full Form | Foreign Institutional Investor |
| DII Full Form | Domestic Institutional Investor |
| FII Regulator | SEBI (under the FPI framework) |
| DII Main Sources | Mutual funds, LIC, banks, pension funds |
| Data Published By | NSE and BSE, daily |
| Typical FII Behaviour | Fast-moving, global-macro driven |
| Typical DII Behaviour | Steady, SIP-driven, stabilising |
1. FII vs DII: The Basic Definitions
In the simplest terms, the FII vs DII distinction comes down to where the money is coming from. An FII is an institution based outside India — a foreign mutual fund, pension fund, hedge fund, or sovereign wealth fund — putting money into Indian stocks, bonds, and derivatives. A DII is an India-based institution — mostly mutual funds, insurance companies like LIC, banks, and pension funds — investing money that's been pooled domestically, largely from ordinary Indian retail investors through SIPs and insurance premiums.
Every trading day, NSE and BSE publish exactly how much FIIs and DIIs bought and sold, and this single FII vs DII data point has become one of the most closely watched numbers in Indian markets, regularly covered by outlets like Moneycontrol and The Economic Times. If you're just starting out, our beginner investing guide and NSE vs BSE explainer are useful companion reads before diving deeper into institutional flow data.
2. What Exactly Is an FII in the FII vs DII Framework
Foreign Institutional Investors are large organisations registered outside India that invest in Indian financial markets after registering with SEBI under the Foreign Portfolio Investor (FPI) framework. Common examples include global mutual funds, pension funds from countries like the US, UK, and Japan, hedge funds, and sovereign wealth funds looking for growth exposure that developed markets can't offer at the same pace.
FII money tends to move fast and in large size — a single FII can move thousands of crores in a day, and their decisions are driven heavily by global factors: US interest rates, dollar strength, geopolitical events, and how India's growth story compares to other emerging markets at any given moment. This is exactly why events like the ongoing US-Iran tension or a US Fed rate decision can trigger sudden, sharp FII selling in Indian markets, even when nothing about Indian companies themselves has changed.
3. What Exactly Is a DII in the FII vs DII Framework
Domestic Institutional Investors are India-registered entities investing money raised within the country. The four main types are mutual funds, insurance companies — led by LIC — banks, and pension or provident fund trusts, with monthly data published by the Association of Mutual Funds in India (AMFI). The single biggest driver of DII strength over the past several years has been the explosive growth of SIP culture: monthly SIP inflows into Indian mutual funds now consistently run into tens of thousands of crores, giving DIIs a predictable, growing pool of capital to deploy every month, almost regardless of global conditions.
This steady, recurring nature is what makes DII flows fundamentally different from FII flows. A DII fund manager isn't reacting to a Fed announcement at 2 am — they're deploying the SIP money that came in that morning from millions of ordinary investors, on a schedule that doesn't change because of a headline. Our complete mutual fund guide and record SIP inflows coverage go deeper into exactly how this domestic capital pool has grown.
4. FII vs DII: 7 Key Differences
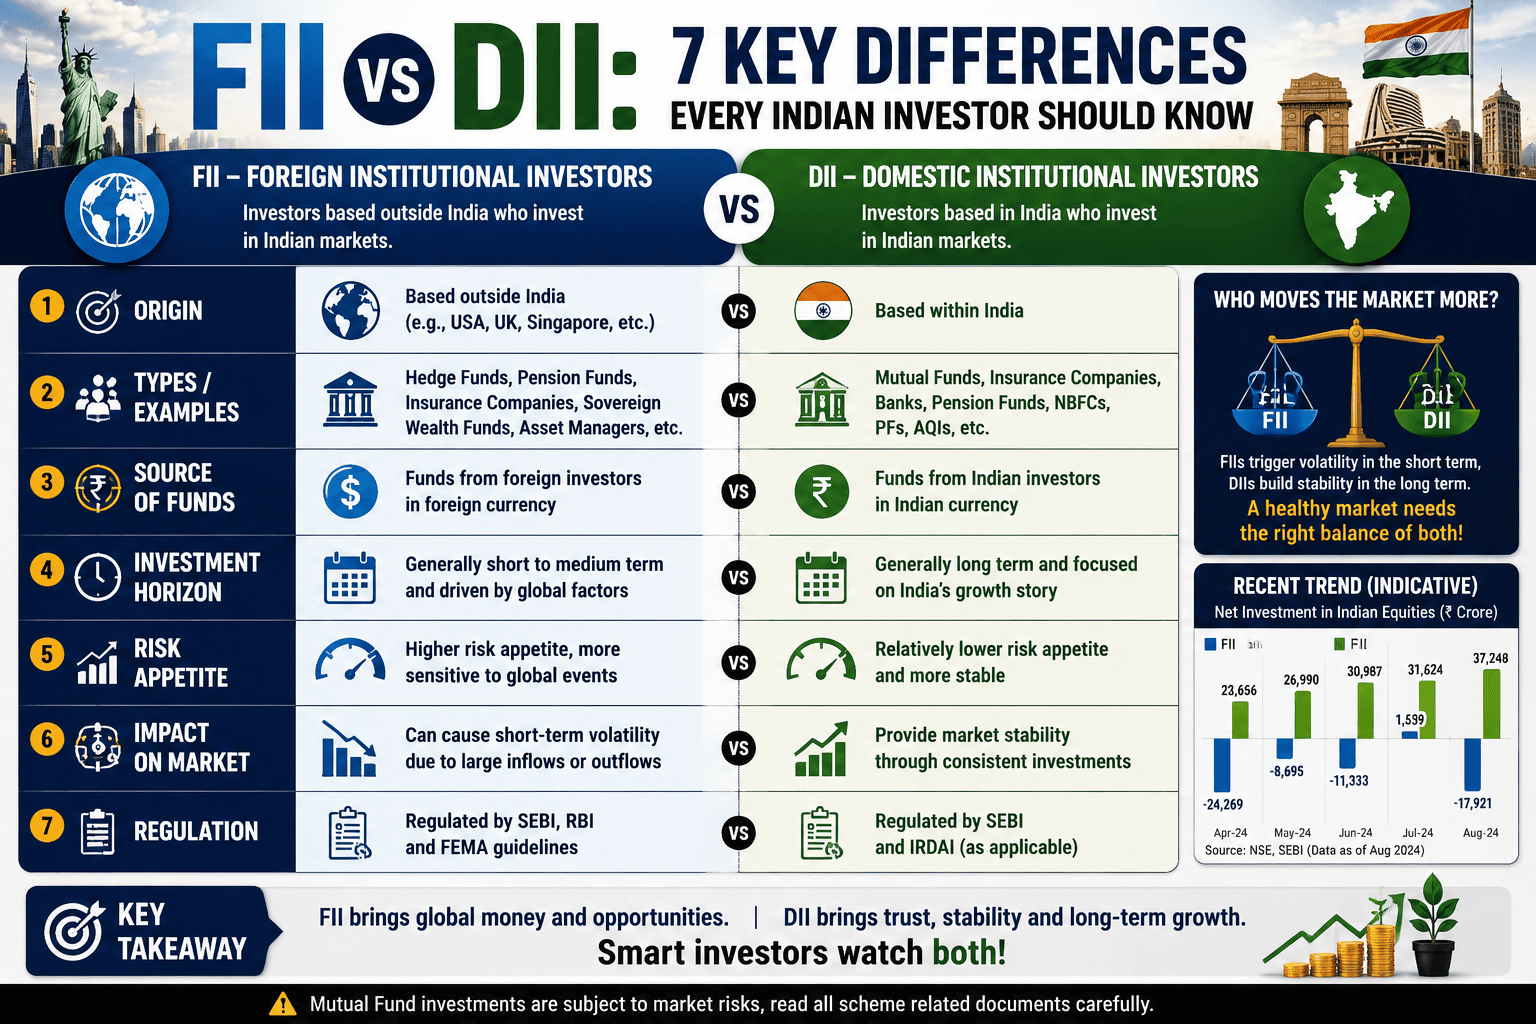
Here's the full FII vs DII comparison side by side, since seeing the contrast directly makes the behavioural patterns much easier to remember.
| Factor | FII | DII |
|---|---|---|
| Source of Capital | Outside India | Within India |
| Primary Driver | Global macro events, dollar strength, rate cycles | Domestic savings, SIP flows, long-term goals |
| Typical Behaviour | Fast entries and exits, momentum-driven | Steady, consistent, less reactive |
| Preferred Stocks | Large-caps, globally relevant sectors (IT, banking, energy) | Large, mid, and small-caps; domestic-focused sectors |
| Market Role | Brings momentum and liquidity | Provides stability during FII outflows |
| Risk Perception | Can exit quickly, seen as more volatile | Seen as a stabilising, "sticky" source of capital |
| Regulator | SEBI, under the FPI framework | SEBI, RBI, IRDAI depending on institution type |
5. How FII vs DII Data Actually Moves the Market
When FIIs buy heavily, it tends to push benchmark indices like the Nifty 50 and Sensex higher, since the sums involved are large enough to shift index-heavyweight stocks meaningfully in a single session. When FIIs sell aggressively — as happened over an extended stretch in late 2024, when FIIs sold more than ₹1.14 lakh crore worth of Indian equities in a single month — markets can correct sharply even when domestic company fundamentals haven't changed at all.
This is where the FII vs DII dynamic becomes genuinely useful to understand. During periods of heavy FII selling, DIIs frequently step in as buyers, absorbing some of that selling pressure and cushioning the fall. This behavioural contrast explains a pattern many retail investors find confusing: why the market sometimes doesn't fall as sharply as FII outflow headlines would suggest. For a live example of this exact dynamic, see our US-Iran tension market impact coverage, where FIIs were net sellers for five straight sessions while DIIs bought for nine consecutive sessions over the same stretch, largely offsetting the foreign outflow.
6. How to Read FII/DII Data Like a Professional
FII and DII figures are published daily by NSE and BSE, and most brokers display them on the dashboard alongside regular market data. A few things genuinely matter when reading FII vs DII data, beyond just the headline "net buy" or "net sell" number for the day.
- Look at the trend, not a single day. One day of FII selling means very little; five or more consecutive sessions of selling is a genuinely different signal worth paying attention to.
- Compare the magnitude, not just the direction. ₹500 crore of FII selling against ₹2,000 crore of DII buying is a very different market than the reverse.
- Check what's driving it. FII selling tied to a specific global event (a rate decision, a geopolitical shock) tends to be more temporary than FII selling driven by a genuine reassessment of India's growth story.
- Watch sector-level FII/DII data, not just the index-level number, since FIIs and DIIs often favour different sectors, and sector-specific flows can matter more for a stock you actually hold than the broad market figure.
Our sector rotation guide and circuit breaker explainer are useful companion reads for understanding how institutional flows interact with sector-level and volatility-driven market mechanics.
7. A Real Example: What Happened This Week
The current week offers a clean, live example of the FII vs DII pattern in action. Amid escalating US-Iran tension and crude oil pushing toward $89 a barrel, FIIs turned net sellers for five consecutive trading sessions, pulling out over ₹1,121 crore in a single day at one point. Over that same window, DIIs were net buyers for nine straight sessions, deploying over ₹1,312 crore on the same day — more than offsetting the FII outflow in absolute terms.
This is precisely the pattern that makes the FII vs DII framework practically useful rather than just theoretical: foreign capital turned cautious on geopolitical risk exactly when domestic capital, backed by steady SIP inflows, kept buying through the volatility. Retail investors who only watched the "FIIs are selling" headline without checking the DII side of the ledger would have missed half the actual story.
8. Common Mistakes Retail Investors Make
The most common mistake is treating FII or DII data as a standalone buy or sell signal. Institutional flow data is a sentiment indicator, not a trading system — using it in isolation, without considering valuations, company fundamentals, or your own investment horizon, is a version of the same behavioural mistake covered in our behavioral mistakes in stock trading guide.
A second common mistake is reacting to a single day's FII number as if it were a trend. As covered above, the real signal is usually in the multi-day pattern, not any individual session's figure. A third mistake is ignoring DII data entirely and only tracking FII flows, since FII-only headlines can make a market look far more fragile than the combined FII-plus-DII picture actually shows — our why investors lose money analysis covers several related patterns worth understanding alongside this one.
9. Frequently Asked Questions
What is the main difference between FII and DII?
FII stands for Foreign Institutional Investor, representing capital from outside India, while DII stands for Domestic Institutional Investor, representing capital pooled within India through mutual funds, insurance, banks, and pension funds.
Why do FIIs sell Indian stocks so suddenly?
FII decisions are driven heavily by global macro factors — US interest rates, dollar strength, and geopolitical events — which can shift quickly and trigger fast, large-scale selling even when Indian company fundamentals haven't changed.
How has DII strength changed the Indian market over time?
The rise of SIP culture has given DIIs a predictable, growing pool of monthly capital, making Indian markets structurally less dependent on FII flows than in earlier decades and providing a stabilising counterweight during periods of foreign selling.
Where can I check daily FII and DII data?
NSE and BSE publish daily FII and DII cash-market figures, and most brokerage platforms display this data on their dashboards alongside regular market information.
Should retail investors trade based on FII/DII data?
FII/DII data works best as a supporting sentiment indicator, not a standalone trading signal. It's more useful for understanding why the market is moving a certain way than for predicting the next move in isolation.
Which sectors do FIIs typically prefer over DIIs?
FIIs generally favour large-cap stocks in globally relevant sectors like IT, banking, and energy, while DIIs invest more broadly across large, mid, and small-cap stocks, often with a tilt toward domestic-focused sectors.

Pranab Barman is a Financial Educator and Personal Finance Researcher with over 10 years of hands-on experience in stock markets, trading, and investing. Currently enrolled in the CFA Program, he is committed to continuous learning and professional excellence in finance.
As the Founder of PlayWithStock, Pranab covers a wide range of topics including Mutual Funds, SIP, Taxation, Stock Market Basics, and Financial Calculators — with a focus on simplifying complex financial concepts for everyday all investors.
Email: support@playwithstock.com
Website: playwithstock.com
Related posts:
 NSE vs BSE: 9 Key Differences Every Investor Must Know
 Crypto Investment Scam: Warning Signs Every Indian Investor Must Know
 Today Nifty India Market Outlook: Oil, Rupee, VIX and FII Selling Explained
 Nifty 50 and Sensex: 7 Things Every Investor Should Know
 Jio IPO 2026: 10 Crucial Facts Every Investor Must Know
 What Is Sector Rotation? A Simple Guide for Indian Investors
 Why Is the Stock Market Falling Today? US-Iran Tensions, Crude Oil Spike & FII Selling Explained
 TCS Q1 FY27 Results Preview: Expected Revenue, Profit, Dividend & Key Things to Watch