

Sensex Nifty Crash July 2026: 3 Real Reasons Behind the Fall
Sensex Nifty Crash July 2026 is exactly what today looked like on every trading screen we had open. Nifty didn't just dip — it broke a level a lot of traders had been watching nervously for weeks. We're writing this the same evening it happened, because half-baked panic explanations spread faster than accurate ones, and we'd rather give you the real three-part story before tomorrow's opening bell.
We've covered market drops before on this blog — our why is the stock market falling today explainer is one of our most-read pieces precisely because this question comes up every few weeks. Today's answer is genuinely more specific than usual, and it's worth understanding in full rather than just absorbing the scary headline number.
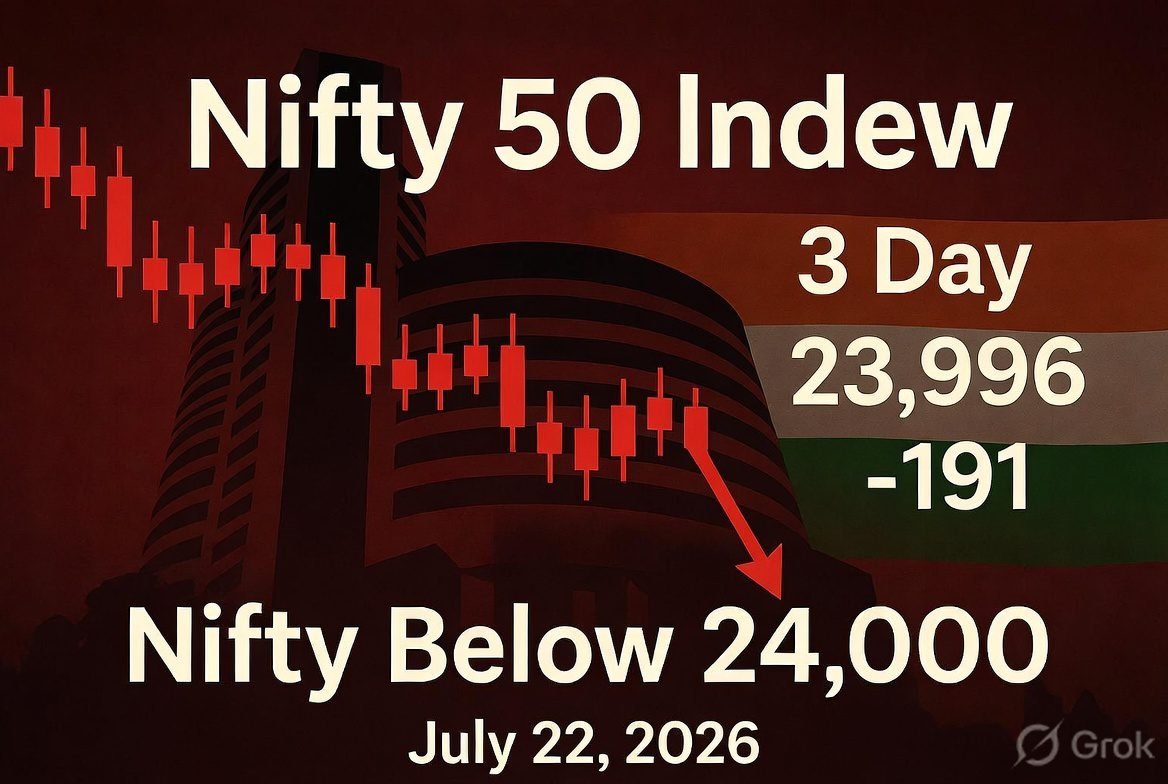
Table of Contents
- What Actually Happened Today
- Reason 1: Crude Oil Crossed $95 a Barrel
- Reason 2: FIIs Have Sold ₹2.6 Lakh Crore This Year
- Reason 3: Trump's New Pharma Tariff Shock
- Which Sectors Got Hit the Hardest
- Why This Is a Three-Day Slide, Not a One-Day Dip
- What Should Retail Investors Actually Do Now
- How This Compares to Past Corrections
- Frequently Asked Questions
What Actually Happened Today
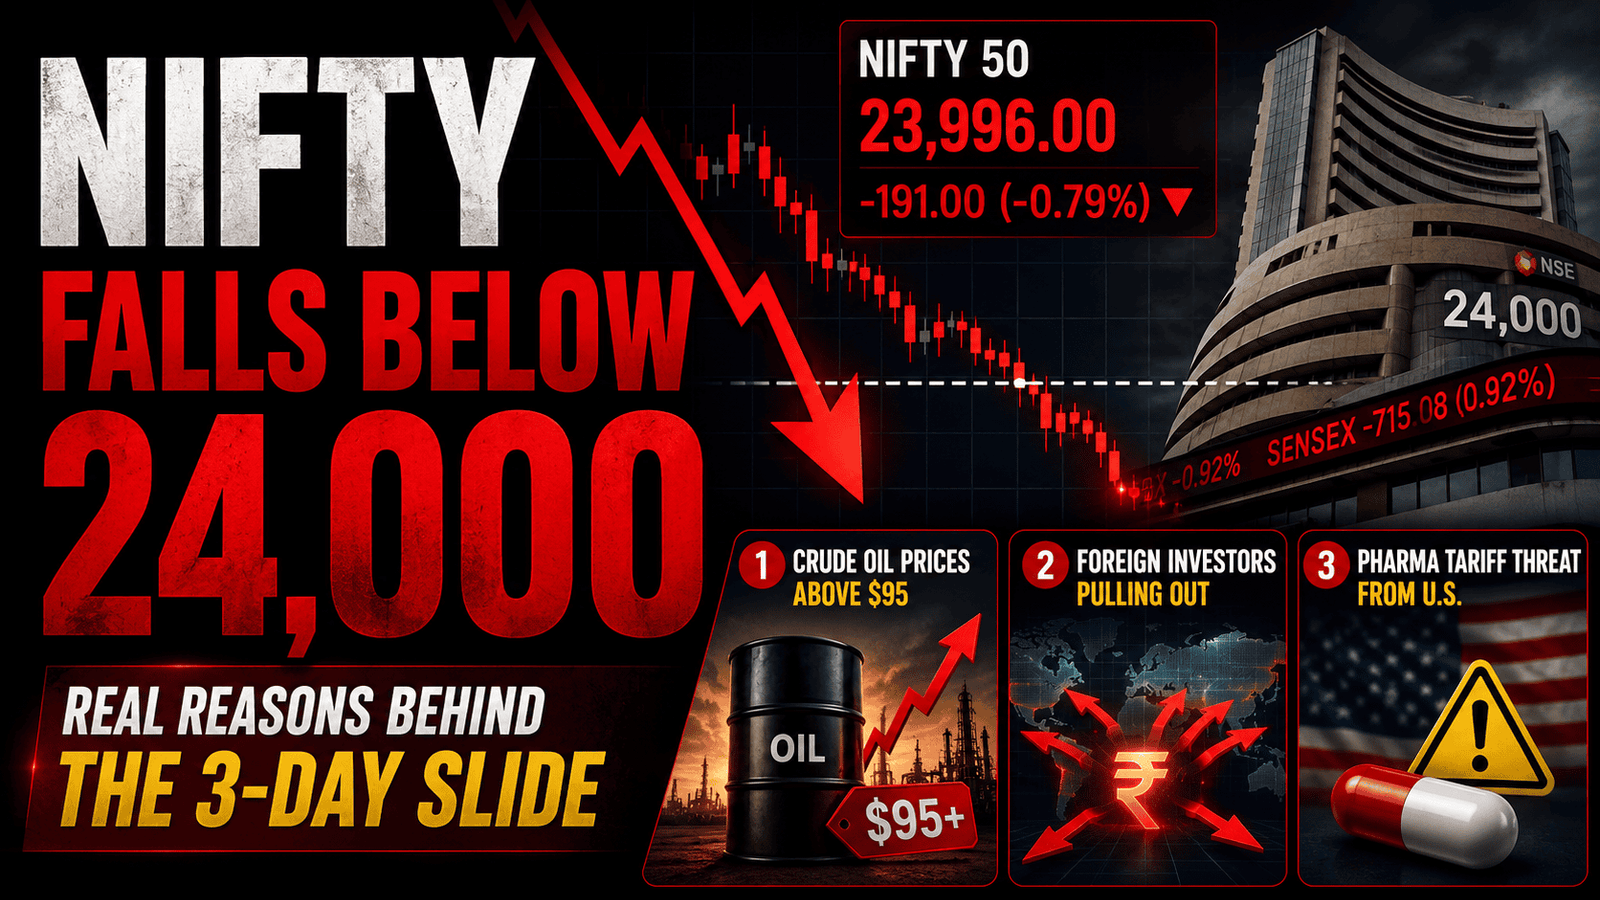
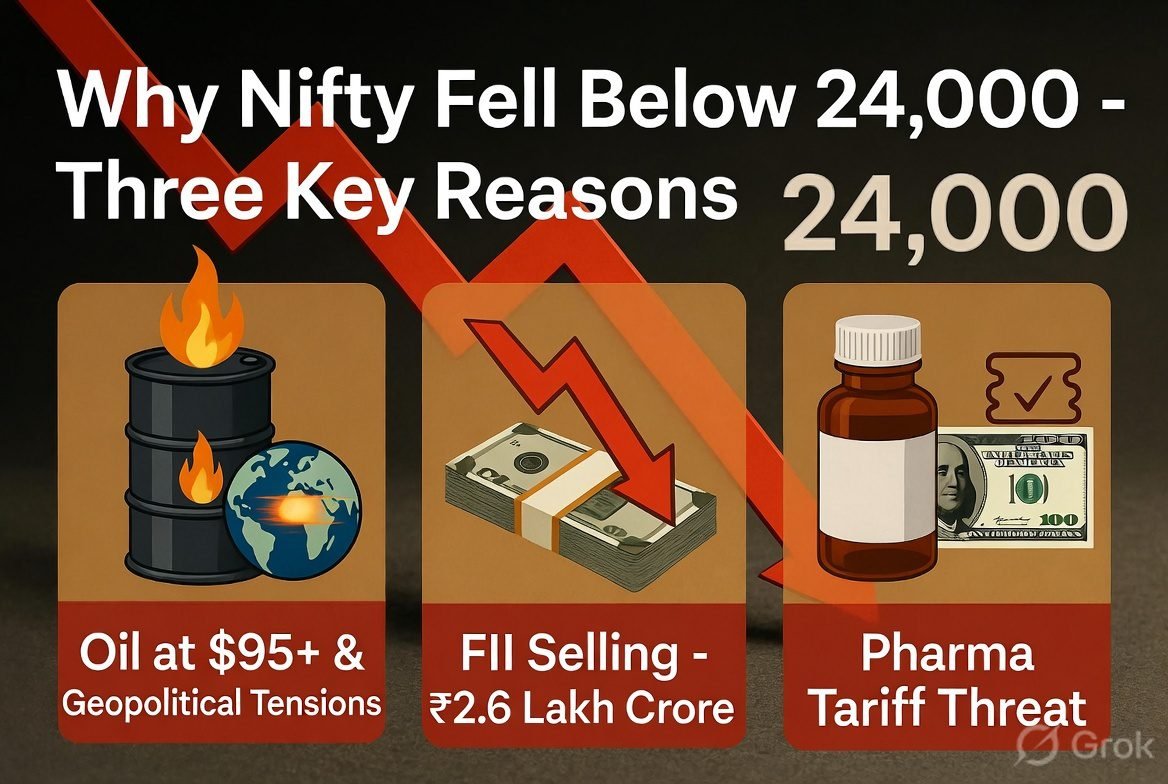
The Sensex fell 715 points, or 0.92%, to close at 76,755, while the Nifty50 dropped 191 points, or 0.79%, to end at 23,996 — slipping below the psychologically important 24,000 mark. This extended the losing streak to a third straight session, with PSU bank and realty shares weighing heaviest on the index. In the broader markets, the Nifty MidCap 100 closed 1.09% lower and the Nifty SmallCap 100 fell 1.54% — a reminder that small and midcap stocks typically bleed harder than the benchmark index during a genuine risk-off day. Live index levels and sector-wise movement can always be verified directly on NSE's live market data page and BSE's Sensex tracker.
Earlier in the day, before the close confirmed the full extent of the drop, GIFT NIFTY futures had already signalled a weaker open, falling 64 points to 24,117 despite positive cues from Asian markets, where most regional indices were trading higher following an overnight rally in US markets after chip makers came under renewed buying interest. That divergence — Asian markets broadly up, India specifically down — is itself a useful signal that today's weakness was driven by India-specific and India-relevant factors rather than a generic global risk-off mood. You can track GIFT Nifty and other Asian index futures live through Investing.com's global indices page.
InterGlobe Aviation, Dr. Reddy's Laboratories, and Jio Financial Services were among the top losers in the Nifty50 index. That combination — an aviation stock, a pharma stock, and a financial services stock — is actually a fairly neat summary of the three separate pressures hitting the market at once, which we'll walk through one at a time.
Reason 1: Crude Oil Crossed $95 a Barrel
Rising crude oil prices pushed the Sensex lower for the third day in a row, with Nifty 50 slipping below the 24,000 mark as selling pressure intensified following an oil price rally to above $95 per barrel. Higher oil prices, driven by West Asia tension, also dented broader risk sentiment across the session.
For an economy that imports the vast majority of its crude, rising oil prices aren't just a market-sentiment story — they translate almost mechanically into higher import bills, pressure on the rupee, and eventually into inflation, which is exactly the kind of factor the RBI weighs at every policy meeting. We've written about this exact chain of cause and effect in our oil price and India impact article and our RBI MPC August 2026 preview, since the upcoming rate decision will almost certainly weigh this same crude spike.
The geopolitical backdrop driving oil higher connects directly to tension around the Strait of Hormuz, a chokepoint we've covered separately, and the broader US-Iran tension story that's been simmering through most of this year. Live crude prices can be tracked on OilPrice.com's crude charts and the US Energy Information Administration's petroleum data page.
Reason 2: FIIs Have Sold ₹2.6 Lakh Crore This Year
FII/DII Activity Snapshot — July 21-22, 2026
| FII buying, Tuesday July 21 | +₹1,650 crore |
| DII selling, Tuesday July 21 | -₹657 crore |
| Total FII selling, 2026 YTD | -₹2,60,662 crore |
Here's where the story gets a little more nuanced than a single day's headline suggests. Foreign institutional investors actually bought shares worth ₹1,650 crore on Tuesday, while domestic institutional investors were net sellers of ₹657 crore. But zoom out to the full year and the picture flips completely: FIIs have sold shares worth ₹2,60,662 crore so far in 2026, according to data from the National Securities Depository Limited (NSDL).
That's a genuinely enormous number, and it's the kind of statistic that's easy to misread in isolation. One green day of FII buying doesn't undo months of sustained selling — and it's exactly this tension between short-term flows and the longer trend that we unpack in our FII vs DII explained article. When foreign money leaves in this volume over an extended period, domestic mutual funds and retail SIP flows genuinely become the market's main support system, which is part of why record SIP inflows in June 2026 matter more than they might otherwise.
It's worth understanding why FIIs sell in the first place, since it's rarely a single simple reason. Rising US bond yields make dollar-denominated assets relatively more attractive compared to emerging market equities, a stronger dollar makes repatriating Indian gains less appealing after currency conversion, and elevated valuations after a strong multi-year run in Indian equities can also trigger profit booking by large global funds rebalancing across markets. Detailed FII flow trends by sector are published regularly by SEBI's FPI statistics page, which is the primary regulatory source for this data rather than any secondary news aggregator.
Reason 3: Trump's New Pharma Tariff Shock
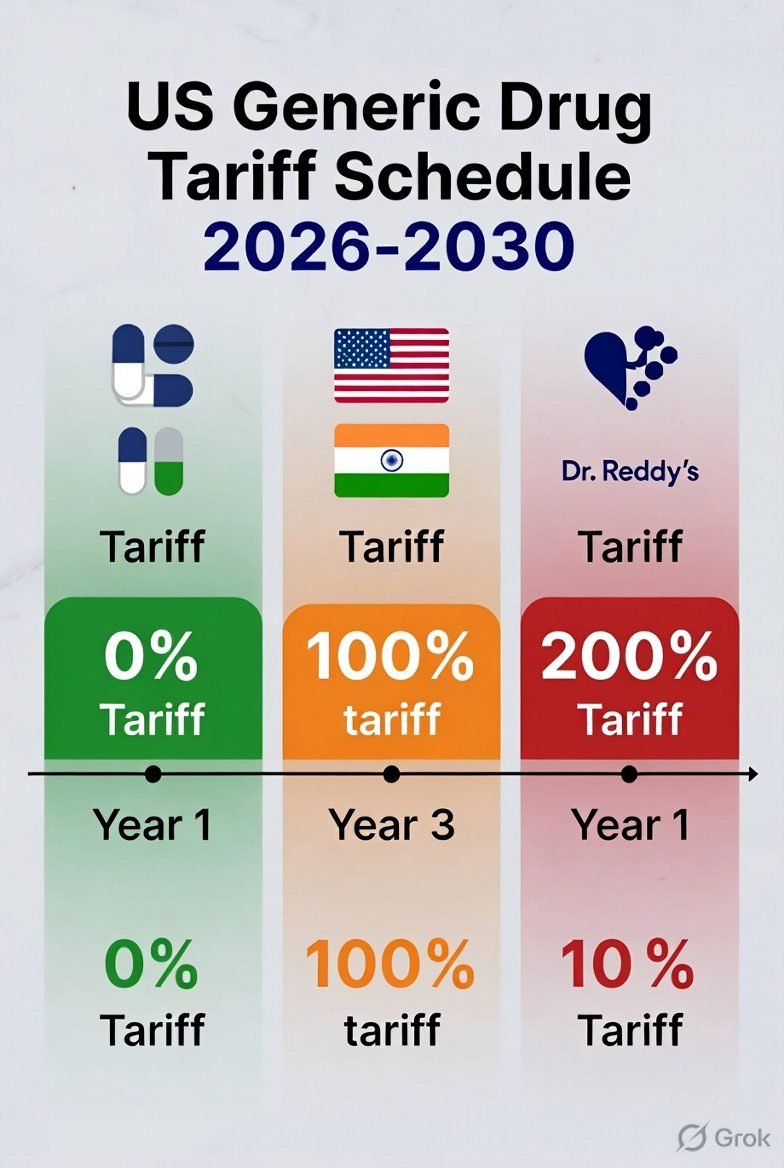
This is arguably the most consequential and specific piece of today's news, and it landed with real precision. US President Donald Trump stated on TruthSocial that effective August 1, 2026, all generic drugs entering the United States will carry a 0% tariff for a two-year period, after which the tariff rises to 100% for one year, and then to 200% thereafter.
| Period | Tariff Rate on Generic Drugs |
|---|---|
| Aug 1, 2026 – roughly 2028 | 0% |
| Following one-year period | 100% |
| Thereafter | 200% |
India is one of the world's largest suppliers of generic drugs to the US market, so a scheduled jump from 0% straight to 100% and eventually 200% is a genuinely serious multi-year overhang for Indian pharma exporters, even with a two-year grace window before it bites. Dr. Reddy's Laboratories was among today's top Nifty50 losers, which is a fairly direct read on how the market is pricing this news for pharma stocks specifically. Industry body reactions and export data on this exact trade relationship are tracked by the Pharmaceuticals Export Promotion Council of India (Pharmexcil) and the US Food and Drug Administration, which regulates generic drug approvals entering the American market.
What makes this announcement particularly tricky to price in immediately is the staggered timeline. A tariff that starts at 0% doesn't hurt anyone tomorrow — but a rational market has to start discounting the 100% and 200% phases years in advance, since pharma companies plan manufacturing capacity, pricing contracts, and supply chains on multi-year horizons, not month-to-month. That's part of why a single stock like Dr. Reddy's can move meaningfully on a policy change that technically doesn't take effect at full strength for roughly three years.
We've tracked this tariff risk building for a while in our US generic drug tariff and pharma stocks article, and it's worth reading alongside our broader India-US trade deal coverage, since pharma tariffs and the wider trade negotiation are genuinely connected threads rather than separate stories. Trump's original tariff announcements and trade policy statements can be verified directly through official Office of the US Trade Representative releases once formal notices are published, since social media statements sometimes get refined in the official filing.
Which Sectors Got Hit the Hardest
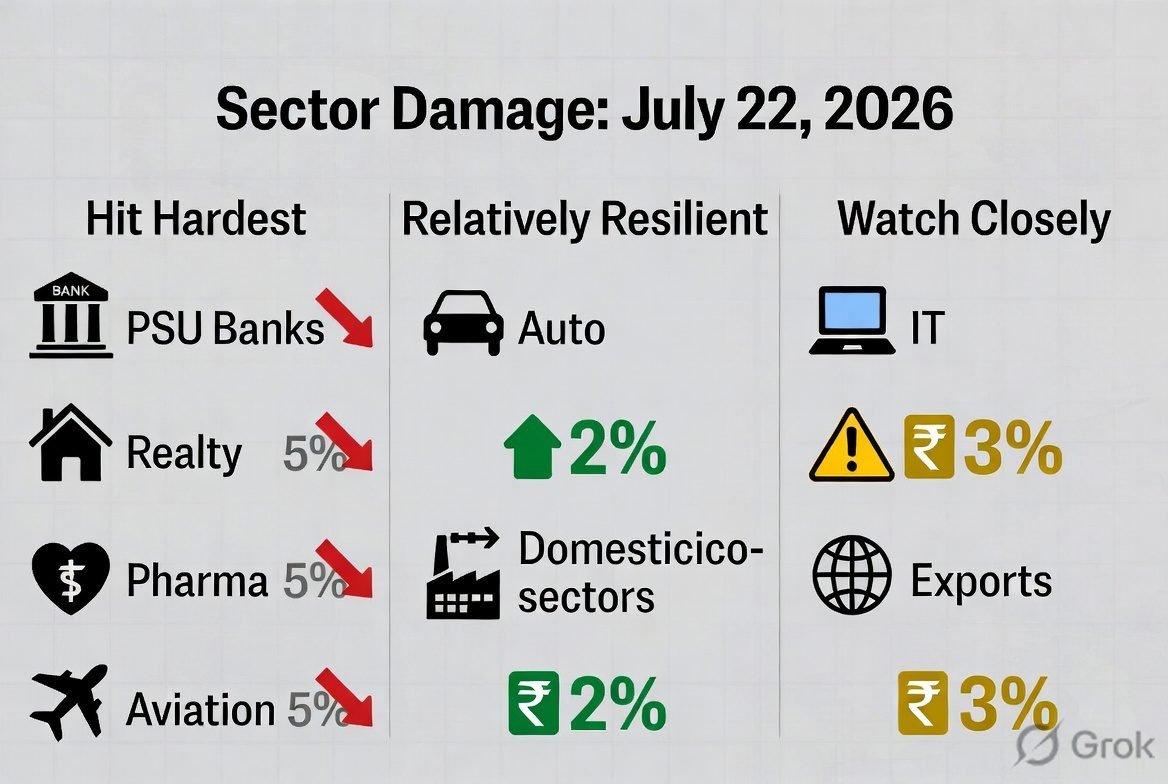
PSU bank and realty shares weighed heaviest on the index today, alongside pharma names reacting to the tariff news. This kind of sector-specific damage, rather than an across-the-board decline, is exactly the pattern our sector rotation guide talks about — money doesn't just vanish from the market, it typically moves toward perceived safety within the same session.
Hit Hardest
PSU Banks, Realty, Pharma (tariff-exposed names), Aviation (oil-cost sensitive)
Relatively Resilient
Sectors less exposed to crude costs and US trade policy, based on today's relative move
Worth Watching Tomorrow
Bajaj Auto, which flagged solid double-digit growth expectations in two- and three-wheeler demand despite the broader market mood
If you're holding banking sector positions specifically, it's worth cross-referencing against our HDFC, ICICI, Axis and Kotak Bank Q1 results coverage and the broader Q1 FY27 earnings calendar, since ongoing results season adds another layer of stock-specific volatility on top of today's macro-driven selloff.
Why This Is a Three-Day Slide, Not a One-Day Dip
A single red day rarely means much on its own — markets have red days constantly. What makes today worth writing about is that it's the third consecutive losing session, which is a genuinely different signal than an isolated dip. Three days in a row of PSU bank and realty weakness, combined with a specific pharma tariff catalyst and a persistent FII outflow story, is a more coherent narrative than most single-day "market falls" headlines actually represent.
This is also exactly the kind of period where the Nifty July seasonality patterns we've written about become relevant context — some of this month's volatility fits a broader seasonal pattern rather than being entirely novel.
What Should Retail Investors Actually Do Now
We're not going to tell you to panic-sell or to blindly "buy the dip" — both are lazy advice dressed up as conviction. What we'd genuinely suggest instead:
Don't make emotional decisions off a three-day chart alone. If you have a long-term SIP running, three red sessions driven by oil, FII flows, and a scheduled tariff two years out is not, on its own, a reason to stop or pause it — our SIP compounding calculator is worth revisiting to remind yourself what pausing actually costs over a multi-year horizon.
Check your specific stock exposure to today's three drivers. If you're holding pharma exporters, banking names, or oil-sensitive stocks like aviation, this is a genuinely relevant week to re-read the fundamentals rather than just watching the price. Our behavioral mistakes in stock trading guide covers exactly the kind of reactive selling that tends to lock in losses during sessions like today's.
Watch the RBI's response, not just the market's. Rising oil prices feed directly into the inflation calculation the RBI will weigh at its August 3-5 MPC meeting — a genuinely more important medium-term signal than any single day's index level.
Resist the urge to average down blindly. Buying more of a stock simply because it's fallen isn't automatically a good decision unless the underlying reason you bought it in the first place still holds. If a pharma stock in your portfolio is down because of a genuine multi-year tariff overhang, that's different from a stock down purely on broad market sentiment with no company-specific bad news — the two situations deserve different responses, not the same instinctive "buy the dip."
Use days like this to actually rebalance, not just react. If today's decline has pushed your equity allocation meaningfully out of line with your target mix, that's a legitimate reason to act — trimming an overweight sector or topping up an underweight one — rather than making a decision purely driven by the day's headline number.
How to Avoid Panic-Selling: Behavioral Mistakes Guide →How This Compares to Past Corrections
Three consecutive down sessions, even with a combined index move under 1% on the worst single day, is a fairly modest pullback by historical standards — nowhere near the kind of multi-week corrections markets have genuinely experienced before. If you want context on how Indian markets have historically recovered from sharper drops, our why investors lose money in the stock market article covers the behavioral pattern of selling into weakness and buying into strength — usually the exact opposite of what actually builds long-term wealth.
It's genuinely useful to separate a "correction" from a "crash" in your own head, since financial media tends to use both words loosely. A correction typically refers to a 10% or greater pullback from a recent high over weeks or months — a normal, recurring part of any market cycle. A crash usually implies a much sharper, faster single-day or single-week collapse, often accompanied by circuit breakers and genuine panic. Today's move, while worth understanding, sits well short of either threshold on its own; it's a notable three-day slide with identifiable causes, not a structural breakdown.
It's also worth remembering that circuit breakers exist specifically to manage genuinely disorderly single-day moves — today's decline, while real, didn't come close to triggering any of those mechanisms, which is itself a useful data point on the actual severity of the move. If you're the kind of investor who likes checking historical index levels before reacting, comparing today's close against past Nifty milestones on the NSE Indices official site can add useful context beyond a single day's percentage change.
What We're Watching Tomorrow
Three things worth checking before markets open again: whether crude oil holds above $95 or eases back, whether FII flows on Wednesday continue the single-day buying seen Tuesday or revert to the broader 2026 selling trend, and how pharma stocks specifically react once the market has had a full trading day to digest the tariff schedule in detail. We'll update this article if there's a meaningful shift on any of these three fronts, following the same live-tracking approach we've used for our Infosys Q1 FY27 results and Reliance Industries results coverage this earnings season.
Frequently Asked Questions
Why did the Sensex and Nifty fall today, July 22, 2026?
Three factors combined: crude oil prices rising above $95 per barrel due to West Asia tension, a persistent year-to-date FII selling trend despite one day of buying, and Trump's announcement of a scheduled generic drug tariff hitting pharma sentiment.
Did Nifty fall below 24,000 today?
Yes, the Nifty50 closed at 23,996, down 191 points or 0.79%, slipping below the psychologically important 24,000 level for the first time in this particular slide.
How much have FIIs sold in Indian markets in 2026?
According to NSDL data, FIIs have sold shares worth ₹2,60,662 crore so far in 2026, even though they were net buyers of ₹1,650 crore on the most recent trading session.
What is Trump's new generic drug tariff and how does it affect Indian pharma?
Effective August 1, 2026, generic drugs entering the US will carry a 0% tariff for two years, then 100% for one year, then 200% thereafter. Since India is a major generic drug exporter to the US, this creates a scheduled multi-year overhang for Indian pharma companies.
Which sectors fell the most in today's market decline?
PSU bank and realty shares weighed heaviest on the index, alongside pharma stocks like Dr. Reddy's reacting to the new US tariff announcement.
Should I sell my stocks or pause my SIP because of this decline?
A three-session decline driven by identifiable, largely external factors is not typically a reason to abandon a long-term investment plan. It's more useful to check your specific exposure to oil-sensitive, pharma, or banking sectors than to make a blanket portfolio decision.
Is this market decline connected to the upcoming RBI policy meeting?
Indirectly, yes. Rising oil prices feed into inflation, which is one of the key factors the RBI's Monetary Policy Committee will weigh at its August 3-5, 2026 meeting.
Our Bottom Line on Today's Decline
We'd rather you leave this article knowing the three specific, real drivers behind today's fall than just remembering that "the market crashed." Oil, FII flows, and a scheduled pharma tariff are all identifiable, trackable factors — not vague fear. That doesn't mean the decline isn't real or worth watching closely, especially if your portfolio has direct exposure to any of the three threads we've covered here.
If you're newer to reading market-decline days like this one, our beginner investing guide and Nifty and Sensex explainer are useful starting points before you make any reactive decision based on a single week's headlines.

Pranab Barman is a Financial Educator and Personal Finance Researcher with over 10 years of hands-on experience in stock markets, trading, and investing. Currently enrolled in the CFA Program, he is committed to continuous learning and professional excellence in finance.
As the Founder of PlayWithStock, Pranab covers a wide range of topics including Mutual Funds, SIP, Taxation, Stock Market Basics, and Financial Calculators — with a focus on simplifying complex financial concepts for everyday all investors.
Email: support@playwithstock.com
Website: playwithstock.com
Related posts:
 Nifty July Seasonality: Why July Is Nifty’s Strongest Month (27-Year Data)
 Monthly SIP of ₹5,000 for 20 Years: Real Numbers, Real Story, and a Calculator
 Nifty 50 and Sensex: 7 Things Every Investor Should Know
 Rupee vs Dollar July 2026: 5 Shocking Reasons the Rupee Is Falling
 Nifty July 2026: Will It Hit 24,800? Complete Market Outlook and Stock Guide
 Passive Investing in India Just Crossed ₹14 Lakh Crore — Here’s the Index Funds vs Active Funds Math Behind It
 Same Fund, Same Manager, Different NAV: Direct vs Regular Mutual Fund Explained With Real Numbers
 TCS Q1 FY27 Results: Profit Rises 5%, Sensex Jumps 828 Points