
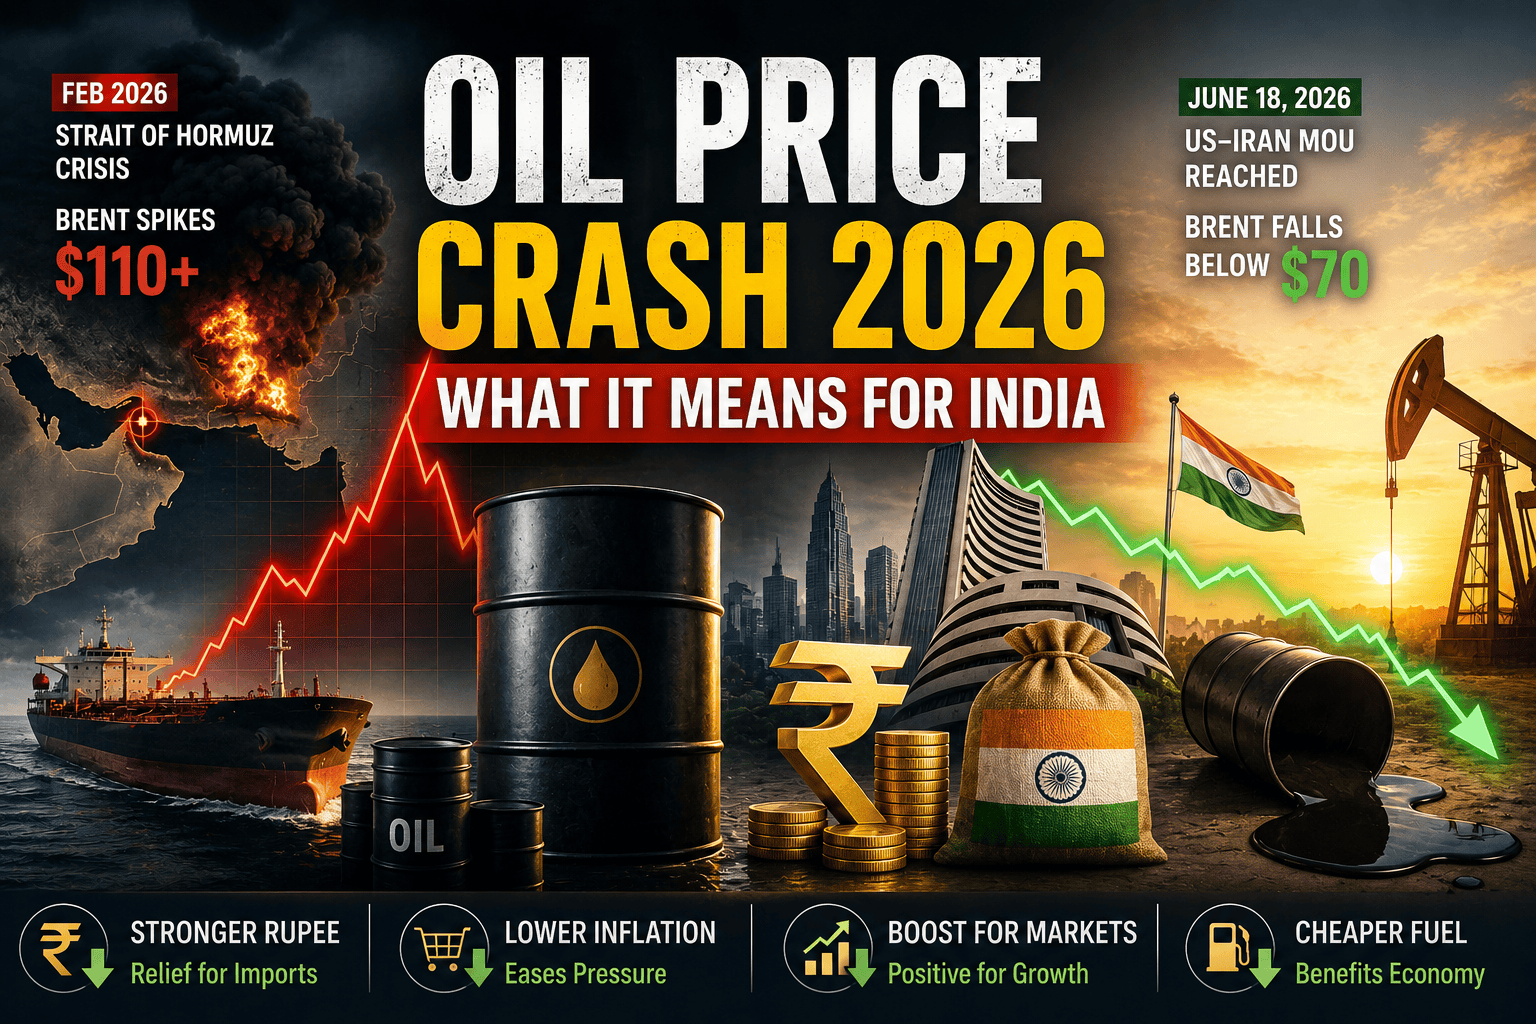

Oil Price Crash 2026: How the End of a War Is Reshaping India's Economy
Four months ago, a war closed the world's most important oil chokepoint and sent crude past $110 a barrel. Today, oil trades below where it stood before the conflict even started. Here's the full arc — and exactly what it means for your rupee, your inflation, and your portfolio.
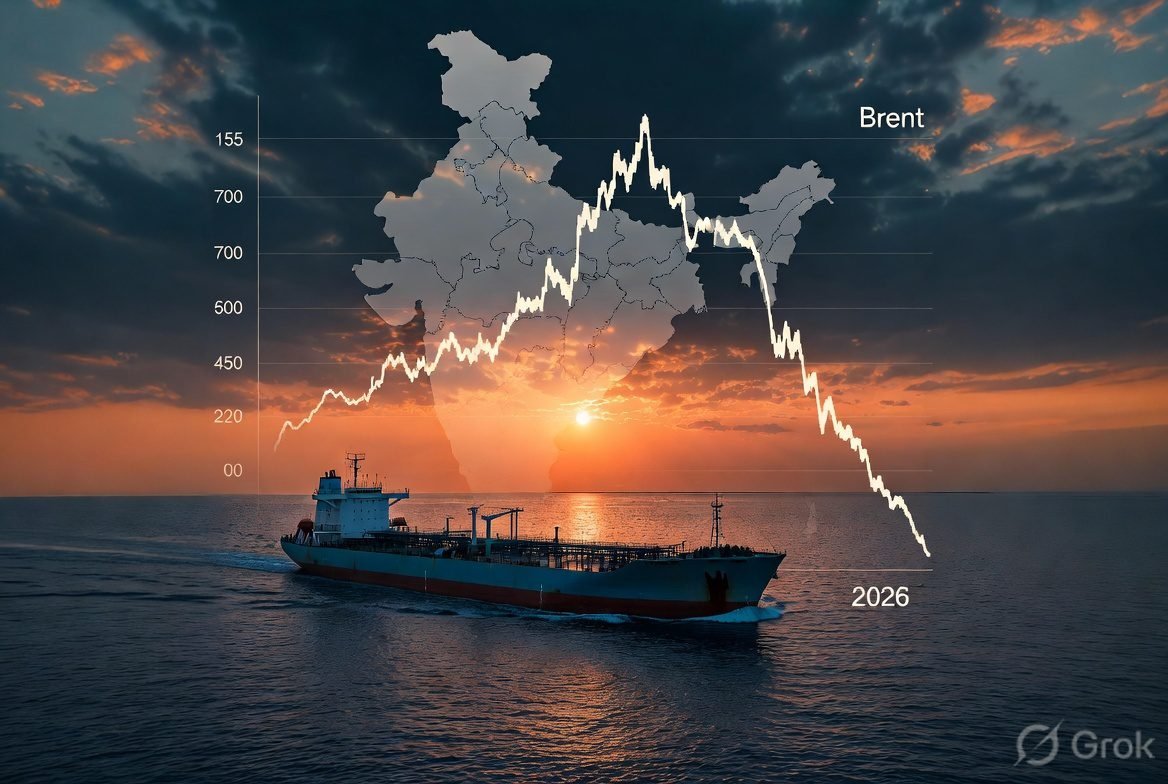
A four-month round trip from crisis to collapse — and India felt every mile of it.
- The War That Started It All
- How Bad It Got: March-May 2026
- The Turnaround: The MOU and the Collapse
- Where Oil Stands Now vs Before the War
- Four Ways Lower Oil Actually Helps India
- Winners: The Sectors and Stocks That Benefit
- Why Your Petrol Price Hasn't Dropped Yet
- The RBI Angle: Inflation and Rate Policy
- China's Wildcard Role
- The Global Ripple Effects Beyond India
- Could Oil Spike Again?
- The 2012-13 Lesson
- What Investors Should Actually Do
- FAQs
Oil Price Crash 2026 is the second half of a story that started as a genuine crisis. Brent crude went from trading in the $70s in late February to briefly touching $119.50 a barrel by March, driven by a war between the US, Israel, and Iran that shut down the Strait of Hormuz — the narrow waterway carrying roughly 20% of the world's oil trade. Four months later, that same crude oil trades below $70 a barrel again, having fully round-tripped back to where it started, and then some.
For India, which imports somewhere between 85% and 89% of its crude oil needs depending on the year, this wasn't an abstract commodity story playing out in a chart. It showed up directly in your LPG cylinder, your petrol pump, your SIP statement, and the interest rate on your next home loan. This piece walks through the full arc — the crisis, the peak damage, the collapse, and what actually changes for India now that oil is cheap again.
The War That Started It All
The conflict that triggered this entire cycle began around 28 February 2026, when hostilities between the US, Israel, and Iran escalated to the point of effectively closing the Strait of Hormuz — the chokepoint between Iran and Oman through which a huge share of Gulf oil exports must physically pass to reach global markets. There is no meaningful workaround for a fully closed Hormuz; tankers either sail through it or they don't move Gulf crude at all.
Markets reacted immediately and violently. Brent crude, which had been trading in a relatively unremarkable range before the escalation, surged past $110 within weeks and touched an intraday high as steep as $119.50 a barrel by March, according to multiple market trackers covering the period. Global oil supply cratered — production shut-ins peaked at 11.2 million barrels per day in May, an extraordinary disruption for a market that normally measures shifts in the low single-digit millions.
How Bad It Got: March-May 2026
The knock-on effects for India arrived fast and compounded on each other. This is worth walking through in sequence, because each piece made the next one worse.
Indian equity benchmarks fell 14-15% from their late-2025/early-2026 highs. Mid-caps and small-caps fell even harder in single weeks — 4.6% and 3.7% respectively in one particularly bad stretch. The rupee hit a fresh all-time low of ₹92.47 per dollar, roughly ₹9 weaker than two years earlier. Gold, in a flight to safety, hit a record ₹14,635 per gram.
India's trade deficit surged to $28.38 billion for the month as the oil import bill ballooned with crude averaging over $114 a barrel. Wholesale Price Index (WPI) inflation jumped to 8.3%, with fuel and power inflation hitting a 42-month high of 24.7%. Retail CPI inflation rose to 3.48%, the highest reading in over a year at that point.
A fresh leg down: crude surged past $113 again, the rupee hit a new record low below ₹96 per dollar, and Indian markets sold off sharply, erasing gains from earlier optimism. Year-to-date FII/FPI outflows from Indian equities exceeded $21.52 billion — a record pace, partly driven by global capital rotating toward AI-linked markets in Japan, South Korea, and Taiwan instead.
State-run oil marketing companies — Indian Oil, Bharat Petroleum, and Hindustan Petroleum — were revealed to be losing close to ₹30,000 crore a month, having held retail petrol, diesel, and LPG prices largely steady despite crude costs surging, to shield consumers. More than 70 days of continuous "under-recovery" had piled up over ₹1 trillion in cumulative losses by this point.
By this point, the standard oil-shock playbook was fully in motion: costlier imports, a weaker currency, higher inflation, capital flight, and state companies absorbing losses to delay the pain reaching ordinary consumers directly.
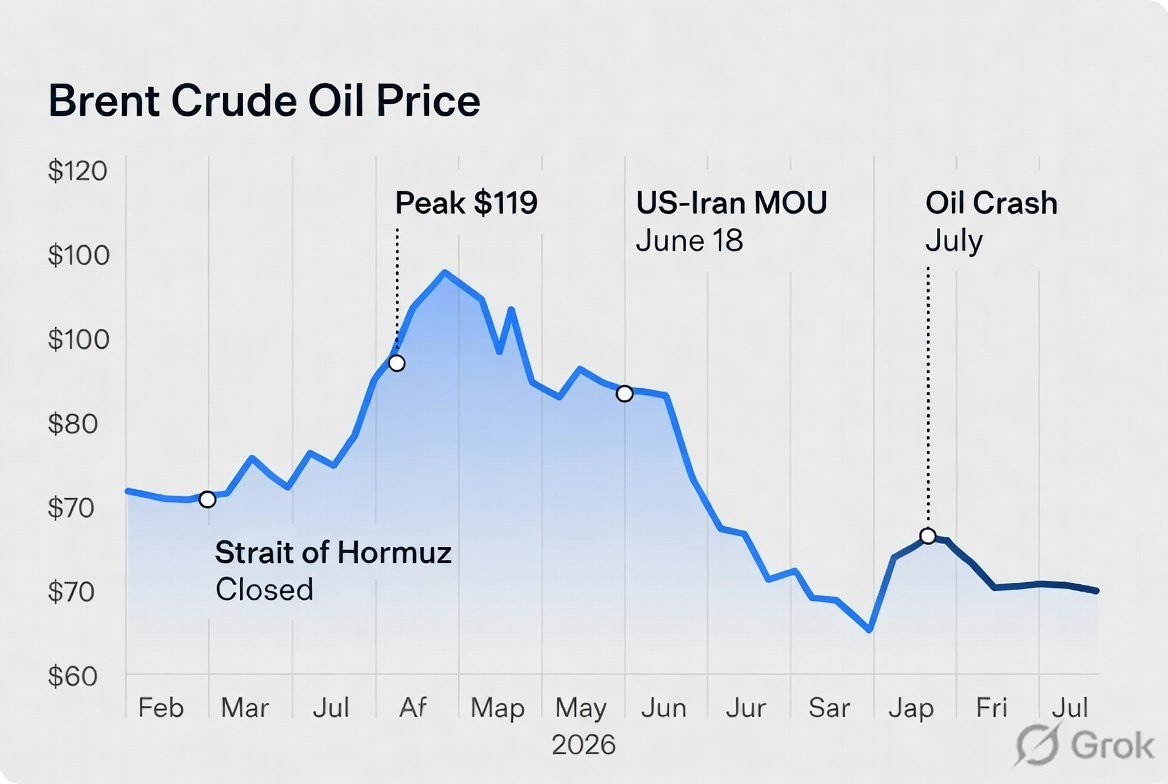
From under $75 to nearly $120 and back below $70 — a genuinely violent four-month round trip.
The Turnaround: The MOU and the Collapse
The United States and Iran signed a memorandum of understanding on 18 June 2026 to end the conflict and reopen the Strait of Hormuz, which had been effectively closed since late February. Reports in the days following described a significant uptick in tanker traffic moving back through the region, both loading and delivering crude and refined products.
The price response was sharp. Brent crude, which had averaged $85 a barrel in June — already well down from the March-May peaks — kept falling, dropping below $70 a barrel on 1 July, essentially back to where prices stood when the conflict began in late February. Global oil supply rebounded by a sharp 4.1 million barrels a day to 98.8 million barrels a day in June alone, as flows through Hormuz resumed and Gulf production began a partial recovery.
Where Oil Stands Now vs Before the War
| Metric | Pre-Conflict (Late Feb) | Peak Crisis (Mar-May) | Now (Early Jul) |
|---|---|---|---|
| Brent Crude | ~$70-75/barrel | $110-119.50/barrel | Below $70/barrel |
| USD/INR | Pre-crisis levels | Record low ~₹92.47-96/$ | Rallying on lower oil |
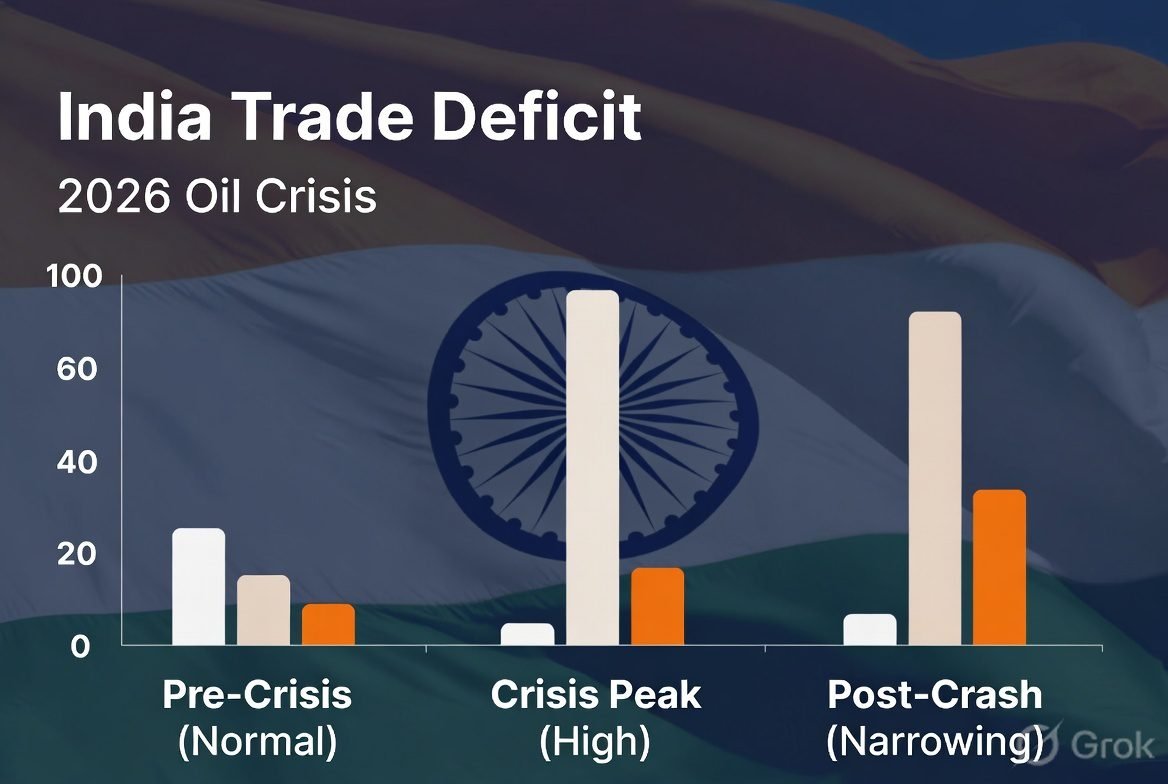
| India Trade Deficit | Normal range | $28.38B in April | Expected to narrow |
| Global Oil Supply | Normal | Shut-ins peaked at 11.2 mb/d in May | Rebounded 4.1 mb/d in June |
The International Energy Agency's July 2026 Oil Market Report notes that world output remains roughly 9.4 million barrels a day below pre-war levels even now, with a full recovery to surplus conditions expected only toward the end of the year — contingent on the ceasefire holding and tanker flows through Hormuz continuing to normalise.
Four Ways Lower Oil Actually Helps India
It's worth being specific about the mechanism, because "lower oil is good for India" is true but vague. Four distinct channels are doing the actual work.
1. A smaller import bill. India buys the overwhelming majority of its crude in dollars. Every $1-per-barrel move in crude adds or removes an estimated ₹12,000-16,000 crore from India's annual oil import bill, according to Motilal Oswal's research — meaning the roughly $40-50 swing in price from crisis peak to current levels represents a genuinely enormous annual number moving in India's favour.
2. A narrower current account deficit. India's CAD is heavily influenced by the oil import bill specifically. A sustained reduction in oil prices can meaningfully narrow the CAD, moving the country toward a more sustainable external position and reducing reliance on foreign borrowing to plug the gap.
3. A stronger, steadier rupee. Lower oil prices reduce India's dollar demand for imports, directly supporting the currency. A stronger or more stable rupee also reduces currency risk for foreign portfolio investors, which can help reverse some of the FII outflow pressure that built up during the crisis months.
4. Reduced imported inflation. Fuel costs feed into transportation and logistics costs across the entire economy, not just at the petrol pump. When crude eases, that cost relief flows through gradually into a wide range of goods — though, importantly, with a real lag rather than instantly.
These four channels reinforce each other in ways that matter for how quickly the improvement actually shows up in the data. A stronger rupee makes the same dollar-denominated oil import bill even cheaper in rupee terms, which further narrows the trade deficit, which further supports the rupee — a genuinely virtuous cycle when it's running in this direction, mirroring exactly the vicious cycle that played out during the crisis months when a weak rupee and expensive oil fed off each other. The speed at which this cycle compounds depends heavily on how long crude actually stays near current levels rather than a single week's price print.
Four channels, one direction — but each moves at a different speed.
Winners: The Sectors and Stocks That Benefit From the Oil Price Crash 2026
Not every sector responds to falling crude the same way, and the Oil Price Crash 2026 has produced genuinely different outcomes depending on where a company sits in the crude value chain.
Benefit From Lower Crude
- Oil Marketing Companies (IOC, BPCL, HPCL) — direct relief from the under-recovery losses that piled up during the crisis
- Airlines — jet fuel is a major cost line; lower crude directly improves margins
- Paints, tyres, chemicals — crude-derivative input costs fall
- Cement, logistics — fuel-heavy operating costs ease
- Select FMCG — lower packaging and transportation costs
Lose From Lower Crude
- ONGC and upstream producers — every $1 drop in crude removes an estimated ₹6,180 crore from ONGC's annual earnings, making it a natural hedge holding during high-oil periods rather than low-oil ones
- Energy exporter-linked plays — broader Gulf and Russia-linked trade flows lose some of their crisis-era pricing power
For OMCs specifically, the reversal is dramatic in scale. Companies that were bleeding a combined ₹30,000 crore a month during the peak of the crisis — with over ₹1 trillion in cumulative under-recovery by mid-May — see that entire dynamic reverse once crude costs fall while retail prices, held artificially steady during the crisis, stay roughly where they are. That gap between falling input costs and sticky retail prices is precisely where OMC margins recover.
Why Your Petrol Price Hasn't Dropped Yet
This is the detail most coverage glosses over. Even with Brent back below $70, retail petrol and diesel prices in India don't automatically fall in lockstep. Retail fuel pricing depends on crude cost, refining costs, taxes, and — critically — the pricing decisions of the largely state-controlled OMCs, who spent the crisis period absorbing losses rather than passing costs through to consumers.
For consumers, this means the psychological "oil crashed, why hasn't petrol gotten cheaper" frustration is a real and reasonable question — but it reflects a genuine trade-off between OMC balance sheet repair and immediate consumer relief, not simply profiteering.
The RBI Angle: Inflation and Rate Policy
Lower oil prices matter enormously for the Reserve Bank of India's inflation calculus, and this connects directly to the broader interest rate story. During the crisis, economists specifically flagged that sustained high crude prices, layered on top of fuel price hikes, risked pushing inflation meaningfully above the RBI's comfort band — a dynamic that would have made rate cuts far less likely, or even raised the odds of a hike, exactly the kind of hawkish scenario markets have been nervously pricing through much of mid-2026.
With crude now back near pre-crisis levels, that specific inflation risk channel eases — though it doesn't eliminate other sources of price pressure the RBI has flagged, including food inflation and monsoon-related volatility. The interaction between oil-driven relief and other inflation drivers is exactly what the RBI will be weighing at its upcoming policy review, alongside the broader rate trajectory covered in our RBI Repo Rate Cut guide.
China's Wildcard Role
One underappreciated piece of this story involves China's own oil-buying behaviour, which has swung sharply in both directions. During the crisis, China tapped its own inventories and imposed fuel export restrictions to weather the disruption — a move that pulled back Chinese purchases and, perversely, helped other countries navigate the supply crunch by leaving more barrels available elsewhere. As the crisis eases, China is now relaxing those export curbs, raising refinery run rates, and reportedly preparing to resume strategic stockpiling later this year.
That matters for where prices go next: China's return to active buying, especially strategic stockpiling, could provide a floor under prices even as the immediate crisis-driven premium continues fading — worth watching as a genuine swing factor over the second half of 2026.
The Global Ripple Effects Beyond India
India wasn't the only economy feeling this. Global oil demand itself contracted meaningfully during the closure — the EIA estimates global oil consumption fell by an average of 1.2 million barrels a day in 2026, with roughly two-thirds of that decline concentrated in non-OECD countries, many of them in Asia, that were most exposed to the disruption in supply. Refined product cracks and margins actually surged to four-year highs in early July even as crude itself fell, as increased crude supplies pushed the raw material price sharply lower while refined product markets — petrol, diesel, jet fuel — remained comparatively tight, still catching up to the sudden restoration of crude flows.
Global refinery runs told a similarly uneven story: they rose by 1.5 million barrels a day in June as the crisis eased, but that figure still sat roughly 6 million barrels a day below the same period a year earlier, with Middle East export-oriented refineries yet to fully restart, Russian throughput curtailed by unrelated attacks on infrastructure, and parts of Asia still running below normal capacity. The IEA's own base case doesn't expect a full return to pre-war supply conditions until well into 2027, even assuming the current de-escalation holds without further incident.
This matters for India specifically because it means the recovery in physical oil availability is lagging the recovery in price — crude got cheap quickly as the risk premium unwound, but the underlying supply chain of refineries, tanker logistics, and inventory levels is still catching up several months behind the price move. That gap is part of why continued volatility, in either direction, remains a live possibility through the rest of 2026 rather than a settled, one-way story.
Could Oil Spike Again?
The entire improved outlook rests on one condition holding: the ceasefire and the reopened Strait of Hormuz. The IEA's own July report is explicit that its more optimistic supply forecasts are "contingent on a swift de-escalation of renewed hostilities" — language that implicitly acknowledges the risk of exactly that not happening. Reports of renewed exchanges of fire in the Gulf even after the MOU underscore that this remains a live, unresolved geopolitical situation rather than a fully settled peace.
For investors and households alike, the practical takeaway is the same one that applied throughout the crisis: don't treat any single week's oil price as a permanent new baseline in either direction. The four-month round trip from $75 to $120 back to $70 is itself the best evidence of how quickly this specific commodity can move when geopolitical risk shifts.
The 2012-13 Lesson
India has been through a version of this before, and the historical parallel is worth remembering precisely because it cuts both ways. During the 2012-13 oil price episode, sustained high crude kept India's trade gap near 4.8% of GDP, the rupee crashed roughly 20%, inflation crossed 9%, the RBI was forced into a tightening cycle, and the Sensex fell over 60% from its peak in the associated broader downturn — a genuinely severe, multi-year drag on the economy.
The 2026 episode, so far, has been sharper but shorter — a four-month crisis rather than a multi-year one, largely because the underlying cause (a specific, addressable conflict) proved resolvable faster than the structural, demand-driven oil price pressures of the early 2010s. That's a meaningfully different pattern, but it's not a guarantee against a repeat if the current ceasefire doesn't hold.
What Investors Should Actually Do
A few practical, non-speculative principles apply here. First, avoid making large portfolio changes purely in reaction to a single week's crude price move — the swings on both sides of this crisis have been genuinely extreme, and chasing each one is a recipe for buying high and selling low repeatedly. Second, if you're specifically overweight oil-sensitive sectors — airlines, paints, chemicals, logistics — understand that your portfolio's sensitivity to further oil volatility (in either direction) is now elevated, and size positions accordingly. Third, continuing systematic SIP investing through periods like this — rather than pausing during the scary months or chasing hard during the recovery — has historically rewarded patient investors more than trying to time either the bottom or the top.
The Bottom Line
Oil Price Crash 2026 is, on balance, genuinely good news for India's macro picture — a narrower trade deficit, room for the rupee to stabilise, easing pressure on the RBI's inflation calculus, and real relief for the oil marketing companies that absorbed enormous losses protecting consumers through the crisis months. But the relief is neither instant nor guaranteed to persist. Retail fuel prices move on their own schedule, other inflation drivers remain in play, and the entire improved picture depends on a ceasefire that, as of this writing, remains a memorandum of understanding rather than a fully resolved peace. Track the fundamentals, not just the headline price, and treat this as a genuinely positive but still-evolving story rather than a settled one.
FAQs: Oil Price Crash 2026
Following a US-Iran memorandum of understanding signed on 18 June 2026 to end the West Asia conflict and reopen the Strait of Hormuz, the risk premium built into oil prices during the four-month crisis unwound quickly, pushing Brent crude below $70 a barrel by 1 July — near where it stood before the conflict began.
Brent crude surged from roughly $70-75 a barrel in late February 2026 to an intraday peak as high as $119.50 a barrel by March, driven by the Strait of Hormuz closure amid the conflict.
India imports roughly 85-89% of its crude oil needs. Every $1-per-barrel change in crude shifts India's annual oil import bill by an estimated ₹12,000-16,000 crore, directly affecting the trade deficit, the rupee, and inflation.
Not necessarily immediately. Retail fuel prices in India depend on crude cost, taxes, and OMC pricing decisions. Since OMCs held prices steady through the expensive crisis months and accumulated significant under-recovery losses, some of the current relief is likely to go toward rebuilding OMC margins rather than an instant retail price cut.
Oil marketing companies (IOC, BPCL, HPCL), airlines, and sectors with significant crude-derivative or fuel-cost exposure such as paints, tyres, chemicals, cement, and logistics typically benefit. Upstream producers like ONGC see reduced earnings when crude falls.
Yes. The International Energy Agency's own forecasts are explicitly contingent on the ceasefire holding, and reports of renewed exchanges of fire in the Gulf even after the MOU underscore that the underlying geopolitical situation remains unresolved rather than fully settled.
The 2012-13 episode was more prolonged, keeping India's trade gap near 4.8% of GDP for an extended period with sustained rupee weakness and high inflation. The 2026 crisis was sharper in magnitude but shorter in duration, given its more specific, resolvable geopolitical trigger.
References: IEA: Oil Market Report, July 2026 · EIA: Short-Term Energy Outlook, Global Oil Markets · Bloomberg: China's Oil Imports Poised to Recover · Business Standard: OMCs Bleed ₹30,000 Crore a Month · Motilal Oswal: How Rising Crude Hits Indian Markets · INDmoney: Crude Near $70 — Impact on India

Pranab Barman is a Financial Educator and Personal Finance Researcher with over 10 years of hands-on experience in stock markets, trading, and investing. Currently enrolled in the CFA Program, he is committed to continuous learning and professional excellence in finance.
As the Founder of PlayWithStock, Pranab covers a wide range of topics including Mutual Funds, SIP, Taxation, Stock Market Basics, and Financial Calculators — with a focus on simplifying complex financial concepts for everyday all investors.
Email: support@playwithstock.com
Website: playwithstock.com
Related posts:
 Why Is the Stock Market Falling Today? US-Iran Tensions, Crude Oil Spike & FII Selling Explained
 Silver Crash 2026: What Happened After Its All-Time High of $121
 Bitcoin Crash 2026: Down 50% From All-Time High — What Happened
 Gold Price Correction 2026: What It Means for Indian Investors
 Gold Price All Time High India: Should You Buy Now or Wait in 2026
 SBI Mutual Fund IPO 2026: Dates, Price Band, GMP & Should You Apply
 Gold Price Prediction Diwali 2026: Will Gold Recover After the Correction?
 Silver Price Surge 2026: Why Silver Is Beating Gold This Year