


Why July Is Nifty's Strongest Month: 27 Years of Data, Explained
Nifty July Seasonality: Why July Is Nifty's Strongest Month (27-Year Data)
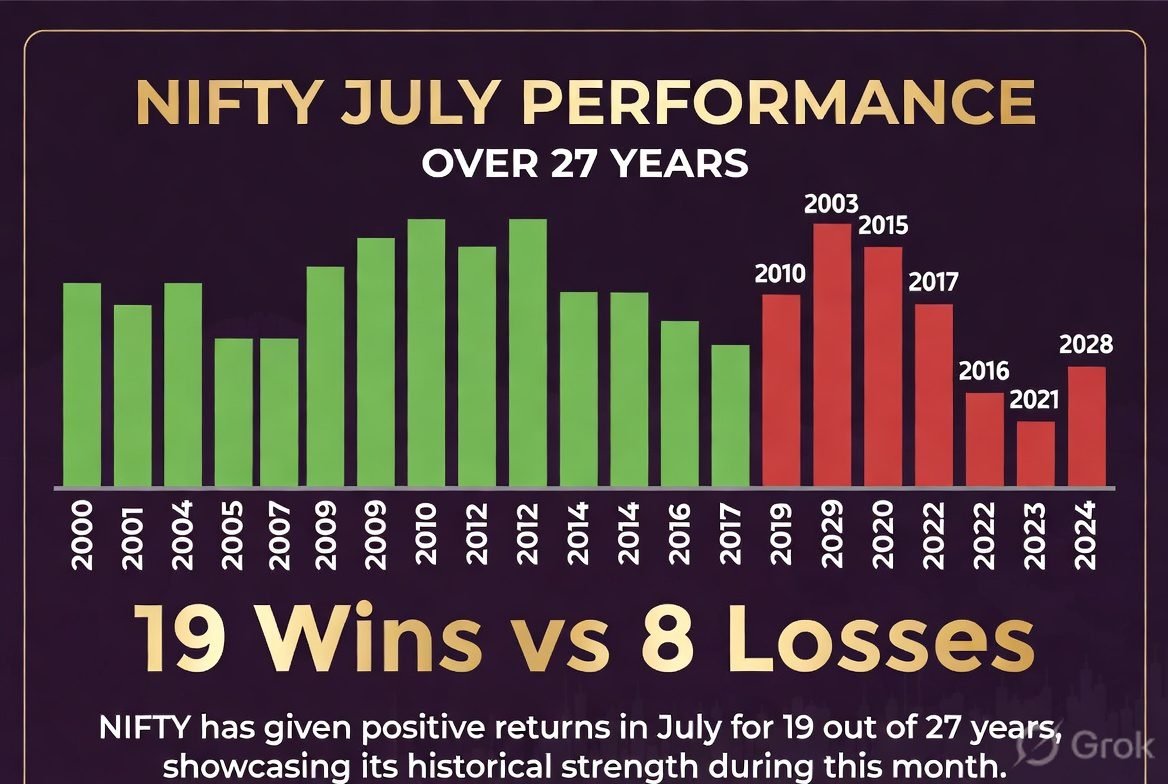
Nifty's July seasonality is one of those patterns that sounds almost too clean to be real. Over the last 27 years, the index has finished July higher in 19 of them — a 70.4% win rate, the strongest of any calendar month tracked. The average return across those 27 Julys sits around 1.75%. I came across this fact almost by accident, buried in a weekly market newsletter, and it stuck with me enough that I wanted to actually dig into where it comes from and whether it means anything you can use.
Short answer: it's real, it's a genuinely interesting pattern, and it should not be treated as a prediction. Let me walk through why.

The Number, Precisely
Let's be specific about what's actually being measured, because "July is a good month" gets repeated a lot with varying degrees of rigour behind it. The figure comes from tracking Nifty's calendar-month closing level against its opening level for every July going back 27 years — from the mid-1990s through 2026. In 19 of those 27 years, the index finished the month higher than it started. In the other 8, it finished lower.
| Metric | Value |
|---|---|
| Years measured | 27 |
| Years positive | 19 (70.4%) |
| Years negative | 8 (29.6%) |
| Average July return | ~1.75% |
| Rank among 12 months | 1st (highest win rate) |
A separate, independently tracked stat backs this up from a slightly different angle: over a ten-year window ending in 2022, July delivered positive returns in 9 of 10 years, with an average gain of around 3% and a standout year that saw an 8.7% rally. Different lookback periods, different exact numbers, but the same underlying shape — July shows up as a genuinely strong month more often than random chance would suggest.
Why Seasonality Exists at All
Before getting too excited about the pattern, it's worth understanding why any calendar-based effect would exist in a market that's supposedly driven by rational pricing of information. A few genuine structural reasons show up in how Indian markets specifically behave around this time of year.
July sits right in the middle of India's Q1 earnings season for the fiscal year — companies reporting April-June results tend to cluster through mid-to-late July, and a fresh earnings cycle often brings renewed institutional attention and fund flows into equities. It's also typically a quieter period for major global macro events compared to, say, the run-up to Union Budget season or year-end positioning in December, which can mean less noise drowning out the underlying trend.
There's also a monsoon angle that's more specific to India than most global markets: by July, the monsoon's progress becomes clearer, and a good monsoon has historically been read as a positive signal for rural demand, agricultural output, and by extension, consumption-linked sectors — a genuinely India-specific seasonal driver that doesn't show up in, say, US market seasonality studies.
The Year the Pattern Broke
This is the part of the story that most "July is a great month" content conveniently leaves out, and it's the part I think matters most. In July 2025, the pattern didn't just weaken — it inverted. Nifty recorded its worst July performance since 2019, shedding roughly 2.9% over the month, driven by a combination of weak corporate earnings, global market jitters, persistent FII outflows, a delayed India-US trade deal, and a sharp correction in IT and banking stocks.
What makes 2025 worth dwelling on isn't just that it broke a streak — it's a clean illustration of exactly how seasonality is supposed to be used and how it so often gets misused instead. A 70% historical win rate means roughly 3 years in 10 you should expect a down July. 2025 wasn't some freak statistical anomaly breaking an otherwise unbreakable law; it was the entirely normal, expected minority outcome finally showing up after a run of good years. Anyone who treated "July is historically strong" as "July will be strong" got a real lesson in the difference between a probability and a promise.

What Actually Seems to Drive July Specifically
Looking at the years when July has performed strongly, a few recurring threads show up alongside the earnings-season and monsoon factors mentioned earlier:
- Post-Q4 result clarity. By July, most large-cap Q4 (Jan-Mar) results and full-year guidance are already digested by the market, meaning less uncertainty going into the new fiscal year's first earnings cycle.
- Institutional flow patterns. Domestic mutual fund SIP inflows have grown into a large, steady source of monthly buying pressure in recent years, providing a consistent floor of demand that isn't as present in markets without India's SIP culture.
- Historically quieter macro calendar. Outside of years with specific global shocks (like 2025's trade deal uncertainty), July doesn't typically carry a major scheduled macro event on the scale of a Union Budget or a major central bank policy pivot.
- A relatively fresh fiscal year. With April 1 marking the start of India's fiscal year, July sits roughly one quarter in — often when initial-year optimism about growth targets and corporate guidance is still intact, before any mid-year disappointments have had time to surface.
How July Compares to Other Months
Seasonality only means something in relative terms — a 70% win rate matters more when you can see it against the other 11 months. Based on the same 27-year tracking period, here's roughly how July's win rate compares to a few other notable months.
Approximate historical win rate by month (illustrative, based on multi-year Nifty data)
The point of putting July next to weaker months isn't to suggest you should trade this calendar effect directly — it's to show that not every month behaves the same way, and that seasonality is a real, measurable, but modest statistical tilt rather than noise. A 70% win rate is meaningfully above what you'd expect from a coin flip, but it's also nowhere close to a guarantee.

How to Actually Think About This as an Investor
I wouldn't build a trading strategy around "buy in June, sell in July" purely on the strength of this pattern — the sample size, while real, is still only 27 data points, and any single bad year (like 2025) can meaningfully dent whatever edge the seasonality theoretically offers, especially once you factor in transaction costs and taxes from moving in and out of positions.
Where I think this data is genuinely useful is as context, not as a signal. If you're already holding a long-term, diversified portfolio and July happens to be a strong month, that's a pleasant tailwind, not something you engineered. If July turns out weak, as it did in 2025, understanding that this falls well within the normal range of outcomes helps you avoid overreacting to a single month's performance as if it were a sign your entire strategy is broken.
For readers who are earlier in their investing journey, our beginner investing guide covers why time in the market tends to matter more than timing specific months, and our explainer on how the stock market's short-term mechanics work is useful background for understanding why any single month, seasonally strong or not, is a small sample in the context of a multi-year investing plan.

Where People Misuse Seasonality
The most common mistake is treating a historical win rate as next year's forecast. A 70.4% win rate means exactly that — 70.4% of the time, historically, not "this year, guaranteed." Confusing the two is how people end up disproportionately shaken by a single bad July, as if the pattern had somehow lied to them rather than simply landing in its normal minority outcome.
The second mistake is ignoring sample size and precision. Twenty-seven years sounds like a lot, but in statistical terms, it's a genuinely small sample when you're trying to draw confident conclusions about a single calendar month's behaviour. The pattern is real and worth knowing, but it deserves the same humility you'd apply to any conclusion drawn from a few dozen data points.
The third, and probably most costly, mistake is letting seasonality override your actual read of current conditions. 2025's earnings weakness, FII outflows, and trade-deal uncertainty were all real, present, current-year factors — and they mattered more than the historical base rate did that particular July. Seasonality is one input among many, and in years where the other inputs are clearly negative, it's the other inputs that should carry more weight.
Frequently Asked Questions
Is it true that July is Nifty's best month historically?
Based on 27 years of data, July has the highest win rate of any calendar month, closing positive in 19 of 27 years (70.4%), with an average return of around 1.75%. It's the strongest month by this specific measure, though "best" depends on which statistic you prioritize.
Did this pattern hold true in 2025?
No. July 2025 was Nifty's worst July performance since 2019, with the index falling around 2.9% for the month, driven by weak earnings, FII outflows, and trade-deal uncertainty. It's a reminder that a historical win rate is a probability, not a guarantee.
Why does Nifty tend to perform well in July?
Several plausible factors contribute: Q1 earnings season activity, typically quieter global macro calendar compared to Budget or year-end periods, steady domestic SIP-driven institutional flows, and India-specific monsoon-related sentiment around agricultural and rural demand outlooks.
Should I invest more money specifically in July because of this pattern?
Not recommended as a standalone strategy. A 70% historical win rate still means roughly 3 in 10 years have been negative, and trying to time contributions around a single month's seasonal tendency adds complexity and cost without a strong enough statistical edge to justify deviating from a consistent, long-term investing approach.
How does July compare to other strong months like December?
July's win rate of roughly 70% sits above other historically decent months like December (around 62%) and November (around 58%), while weaker months like September and February have historically been closer to a coin flip or slightly negative.
Is seasonality a reliable way to time the stock market?
Seasonality reflects historical statistical tendencies, not predictive certainty. It's useful as background context for understanding market patterns, but current-year fundamentals, earnings trends, and macro conditions typically matter more for any given year's actual performance than historical calendar patterns.
Sources

Pranab Barman is a Financial Educator and Personal Finance Researcher with over 10 years of hands-on experience in stock markets, trading, and investing. Currently enrolled in the CFA Program, he is committed to continuous learning and professional excellence in finance.
As the Founder of PlayWithStock, Pranab covers a wide range of topics including Mutual Funds, SIP, Taxation, Stock Market Basics, and Financial Calculators — with a focus on simplifying complex financial concepts for everyday all investors.
Email: support@playwithstock.com
Website: playwithstock.com
Related posts:
 Silver Price Surge 2026: Why Silver Is Beating Gold This Year
 Nifty July 2026: Will It Hit 24,800? Complete Market Outlook and Stock Guide
 Nifty 50 and Sensex: 7 Things Every Investor Should Know
 What is Nifty Midcap 150? Complete Guide and Should You Invest in 2026
 Fed Rate Hike 2026: Why the July 28-29 FOMC Meeting Could Change Everything
 Why Investors Lose Money: 7 Costly Mistakes to Avoid
 What is a Stock Split and Why Do Companies Do It
 Reliance Industries Q1 FY27 Results Preview: What to Expect on July 17