
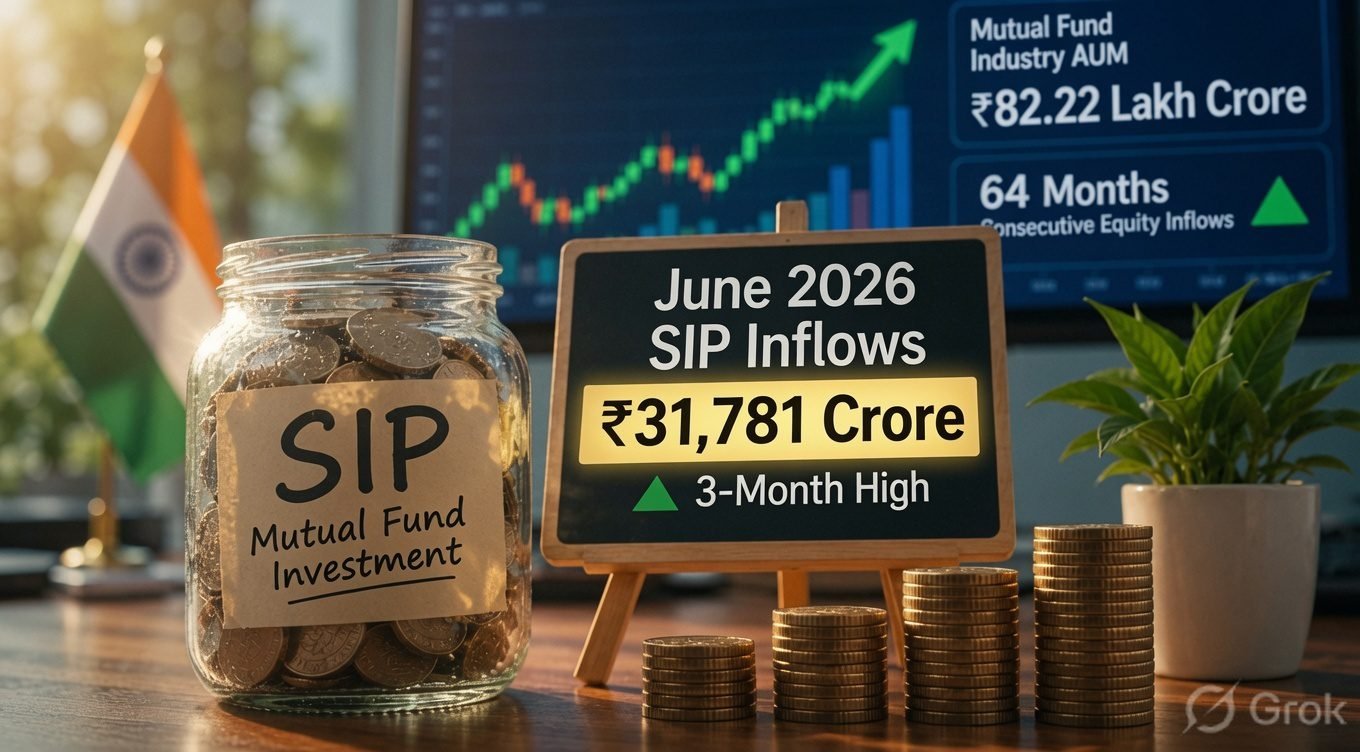

Record SIP Inflows June 2026: Indians Just Invested ₹31,781 Crore
While headlines chased IPOs and inflation data, millions of ordinary Indians quietly did something remarkable: they kept investing, in record numbers, for the 64th month running.
There's a version of the Indian investor that never makes headlines. No dramatic IPO application, no crypto panic, no GMP obsession. Just a fixed amount, leaving their bank account on the same date every month, quietly compounding. In June 2026, record SIP inflows data revealed just how large that quiet crowd has become, and the number is genuinely worth sitting with.

The Month, In Five Charts
Swipe / scroll →A Three-Month High
SIP contributions rose to a 3-month high, up 16.5% from June last year.
64 Straight Months
Equity mutual funds have now recorded 64 consecutive months of positive net inflows.
Every Cap Size Gained
Mid-caps led at ₹6,090 crore, followed by small-caps at ₹5,602 crore — broad participation, not one hot pocket.
Gold ETFs Flip 570%
Gold ETFs swung from a ₹725 crore outflow to a ₹3,443 crore inflow — a 570% turnaround.
Record AUM
Total mutual fund industry AUM touched a fresh record high in June 2026.
1. The Number That Matters: ₹31,781 Crore
India's record SIP inflows for June 2026 came in at ₹31,781 crore, a three-month high and a 16.5% jump over the same month a year earlier, according to data released by the Association of Mutual Funds in India and reported in detail by Blitz India Media. That's up from ₹30,552 crore in May, a genuinely meaningful acceleration month over month.
To put ₹31,781 crore in perspective, this single month of SIP contributions is larger than the entire annual budget of many mid-sized Indian states. And this wasn't a one-off spike tied to a market rally or a viral trend. It's the continuation of a habit that's been building, quietly and steadily, for years.
What makes this figure genuinely interesting isn't just its size, but its timing. June 2026 wasn't a month of unambiguous good news. Markets were digesting elevated crude oil prices, geopolitical tension in West Asia, and the early signs of what would later become a broader conversation about food inflation and monsoon shortfalls. Investors kept contributing anyway, which says something meaningful about how differently SIP-based investing behaves compared to lump-sum, sentiment-driven capital.
2. 64 Months: The Real Headline Hiding in the Data
Here's the number I think deserves more attention than the headline figure itself: equity mutual funds have now posted 64 consecutive months of positive net inflows, according to Whalesbook's coverage of the AMFI data. That's more than five straight years without a single month of net redemptions in equity-oriented schemes.
Think about everything that's happened globally in those five-plus years, geopolitical shocks, rate cycles, currency swings, entire asset classes crashing 50% and recovering. Through all of it, Indian equity mutual fund flows never once turned negative on a net monthly basis. That's not luck. That's a structural shift in how a growing share of Indian households relate to markets, treating them as a place for disciplined, long-term participation rather than a casino to enter and exit based on headlines.

3. Where the Money Actually Went
Equity mutual funds overall pulled in net inflows of ₹28,973.41 crore in June, up nearly 26% from ₹22,907.77 crore in May, according to Business Today's detailed AMFI breakdown.
| Category | June 2026 Inflow | vs May 2026 |
|---|---|---|
| Mid-Cap Funds | ₹6,090.17 crore | Up from ₹4,385.06 crore |
| Small-Cap Funds | ₹5,601.96 crore | Down slightly from ₹6,263.56 crore |
| Flexi-Cap Funds | ₹5,231.31 crore | Up from ₹4,945.57 crore |
| Multi-Cap Funds | ₹3,070.26 crore | Steady demand |
| Large-Cap Funds | ₹2,067.48 crore | Up from ₹1,592.93 crore |
What stands out here isn't any single category running away with all the attention. It's the breadth. Mid-caps led, small-caps stayed strong despite a slight pullback, and even the more conservative large-cap and multi-cap categories picked up pace. Investors were participating across the market-cap spectrum, not piling into one narrow, currently-fashionable pocket of the market, a pattern that tends to be healthier for the ecosystem than a single-theme stampede.
Hybrid funds added another layer to this story, posting net inflows of ₹12,892.76 crore during June. Within that category, arbitrage funds attracted the largest share at ₹5,799 crore, followed by multi-asset allocation funds at ₹4,810 crore, suggesting a meaningful segment of investors were specifically seeking lower-volatility, tax-efficient exposure rather than pure equity risk. Sectoral and thematic funds nearly doubled their inflows too, rising to ₹1,469.26 crore from ₹647.87 crore in May, a sign that thematic conviction hadn't disappeared even as broader flows diversified across the market-cap spectrum.
4. The Gold ETF Surprise Nobody Saw Coming
Buried inside the same AMFI release is a genuinely dramatic swing that deserves its own spotlight. Gold ETFs went from a net outflow of ₹725 crore in May to a net inflow of ₹3,443.23 crore in June, a turnaround of roughly 570%, according to Lapaas Voice's reporting on the category-level data.
This lines up neatly with what we covered in our own deep dive on gold's dramatic 2026 price action, where the metal touched an all-time high in March before correcting. What this SIP data adds is the investor behavior layer: rather than chasing gold at its peak, a meaningful wave of Indian money appears to have moved in during the correction, exactly the kind of buy-the-dip behavior that, in hindsight, tends to work out better than buying at euphoric highs.

5. The Quiet Debt Fund Exodus
While equity and gold captured headlines, debt mutual funds saw net outflows of ₹1.09 lakh crore in June, even larger than May's ₹96,948.51 crore redemption. Liquid funds alone saw ₹42,293.29 crore leave.
This isn't necessarily a warning sign. It likely reflects a mix of corporate treasury cash management cycles, tax-related withdrawals given the approaching ITR filing deadline, and investors rotating capital toward the equity and gold opportunities that dominated the month's narrative. Still, a debt outflow of this size is worth knowing about rather than only seeing the celebratory equity headline.
6. Fewer People Are Quitting Their SIPs
One quieter but genuinely important data point: the SIP stoppage ratio, which measures how many SIP accounts get discontinued relative to how many new ones start, reached a six-month low in June, according to Whalesbook's data analysis. New registrations are outpacing account closures at an improving rate.
This matters because SIP discipline is genuinely hard to maintain when markets wobble. A falling stoppage ratio suggests Indian retail investors are getting better, on average, at staying invested through short-term noise rather than panic-stopping contributions the moment a headline turns negative, a pattern connected to the behavioral traps covered in our piece on why investors lose money in the stock market.
7. A Record ₹82.22 Lakh Crore Industry
All of this flowed into an industry that closed June with total assets under management of ₹82.22 lakh crore, up 0.79% month-on-month and a fresh all-time high, according to industry data compiled by Whalesbook. Passive investment products, ETFs, index funds, and fund-of-funds, saw a sharp improvement too, pulling in ₹16,724 crore compared to just ₹361 crore in May.
This scale is genuinely relevant for anyone tracking IPO activity too, since large asset managers benefit directly from rising AUM. Our coverage of the SBI Mutual Fund IPO, which opened for subscription this same week, sits directly against this backdrop of a record, still-growing industry.

8. Calculate Your Own SIP Growth
Numbers like ₹31,781 crore are easier to appreciate in the abstract than in your own life. Use the calculator below to see what a monthly SIP of your own could realistically grow into, based on the same kind of long-term compounding that's driven this year's record inflows.
This is an illustrative estimate using standard SIP compounding math, not a guarantee. Actual mutual fund returns vary with market performance. Not investment advice.
9. What This Actually Means for You
If you already run a SIP, this data is a quiet form of validation: you're part of a genuinely large, sustained, five-year trend, not a passing fad. If you don't yet have one running, the 64-month streak is worth internalizing as a signal about how disciplined, automated investing tends to outperform the emotional alternative of trying to time entries and exits around headlines.
Structuring how much to actually allocate toward SIPs within a broader monthly budget is where frameworks like the 50/30/20 budgeting rule become genuinely useful, and for anyone entirely new to this, our beginner investing guide covers the foundational mechanics of how SIPs actually compound over time.
Worth reading alongside this data
This SIP story connects to several other 2026 investing themes we've covered, including silver's dramatic price swings, Bitcoin's 50% drawdown, and broader Nifty and Sensex movements this year, together painting a picture of where and how Indian household capital is actually being deployed in 2026.
Real-World Example
Consider two investors in early 2021. One started a modest monthly SIP and, despite every temptation to stop during volatile stretches over the following five years, simply let it run automatically. The other tried to time the market, pausing contributions during downturns and resuming only after prices had already recovered, a pattern that tends to lock in the worst of both worlds: missing cheap entry points and buying back in at higher prices. The 64-month streak of positive equity inflows nationally suggests the first investor's approach has become increasingly common, not because Indian households suddenly became expert market timers, but because more of them stopped trying to be. Readers building this kind of discipline can also think about complementary tools like a sinking fund for predictable annual expenses, which keeps short-term spending needs separate from long-term SIP contributions rather than competing with them. More coverage is available in our Personal Finance category and Stock Market category, and readers thinking about tax-advantaged alternatives alongside their SIPs may find our comparison of term insurance versus endowment plans useful for rounding out a complete financial plan. Given how closely this data connects to broader compliance season, our recent coverage of India's crypto tax notice crackdown is also worth a read if any of your investment activity spans both traditional funds and digital assets this year.
10. FAQs
What were India's SIP inflows in June 2026?
SIP inflows reached ₹31,781 crore in June 2026, a three-month high and a 16.5% increase over June 2025, according to AMFI data.
How many consecutive months have equity funds seen positive inflows?
Equity mutual funds have recorded 64 consecutive months of positive net inflows, a streak spanning more than five years.
Why did gold ETF inflows jump so dramatically in June 2026?
Gold ETFs swung from a ₹725 crore net outflow in May to a ₹3,443.23 crore net inflow in June, a roughly 570% turnaround, likely reflecting investors buying during gold's price correction after its March 2026 all-time high.
What is the total mutual fund industry AUM in India?
The Indian mutual fund industry's total assets under management reached a record ₹82.22 lakh crore in June 2026, up 0.79% from the previous month.
Should I start a SIP based on this data?
This data reflects broad market participation trends, not a recommendation for any individual's specific financial situation. This is not investment advice; consult a SEBI-registered financial advisor to determine what's appropriate for your own goals and risk tolerance.
How is SIP maturity value calculated?
SIP returns are calculated using the compounding formula FV = P × [(1+i)^n − 1] / i × (1+i), where P is the monthly investment, i is the monthly rate of return, and n is the total number of months. Use the calculator above to estimate your own SIP's potential growth based on this formula.
- AMFI — Official mutual fund industry data
- Blitz India Media — June 2026 SIP inflow report
- Business Today — Detailed category-wise breakdown
- Lapaas Voice — Gold ETF and passive fund data
- Whalesbook — SIP stoppage ratio and AUM data
- SEBI — Mutual fund regulatory framework
- NSE India — Market data and index performance
- BSE India — Exchange data
- Value Research — Mutual fund category analysis
- Morningstar India — Fund performance and category data
- CRISIL — Mutual fund industry research
- Groww — SIP investment platform data
- Zerodha Varsity — SIP and mutual fund education
- Reserve Bank of India — Broader household savings context
- Mirae Asset Investment Managers — Industry commentary

Pranab Barman is a Financial Educator and Personal Finance Researcher with over 10 years of hands-on experience in stock markets, trading, and investing. Currently enrolled in the CFA Program, he is committed to continuous learning and professional excellence in finance.
As the Founder of PlayWithStock, Pranab covers a wide range of topics including Mutual Funds, SIP, Taxation, Stock Market Basics, and Financial Calculators — with a focus on simplifying complex financial concepts for everyday all investors.
Email: support@playwithstock.com
Website: playwithstock.com
Related posts:
 Monsoon 2026 India Inflation: Why a Dry June Hits Grocery Bills
 The Ultimate Budgeting Guide That Works in 2026
 Term Insurance vs Endowment Plan: Which is Better for Beginners in 2026
 ITR Filing Last Date 2026: July 31 Deadline, New Tax Act & Penalties
 ITR-4 Investment Disclosure Calculator: New 2026 Rule for Presumptive Taxpayers
 GST 2.0 for E-commerce Sellers (2026): Complete Guide
 How to Set Up a Sinking Fund for Festival Expenses
 What Are Life Cycle Funds? SEBI’s Quiet New Mutual Fund Category