

India Exports Q1 FY27: The Complete Growth Story (And the Part Most Headlines Skipped)
Merchandise exports jumped nearly 16% to cross $129 billion — genuinely strong growth. But imports grew even faster, and the trade deficit almost doubled. Here's the full picture, sector by sector.
Real growth, real numbers — and a real trade-off most coverage left out of the headline.
- The Headline Numbers
- Sector by Sector: What's Actually Driving the 15.92% Growth
- Where This Fits in India's Longer Export Trajectory
- The Part Most Headlines Skipped: Why the Deficit Widened Faster
- June Alone: A Closer Look at the Monthly Spike
- Where These Exports Are Actually Going
- Where the Import Surge Is Coming From
- Services: The Quiet, Reliable Surplus Engine
- Connecting the Dots: CETA, Gold, and the Gems Story
- The Forecast That Undershot by a Mile
- What This Means at the Company Level
- What This Means for the Rupee and RBI
- Is This Growth Sustainable?
- What It Means for Investors
- FAQs
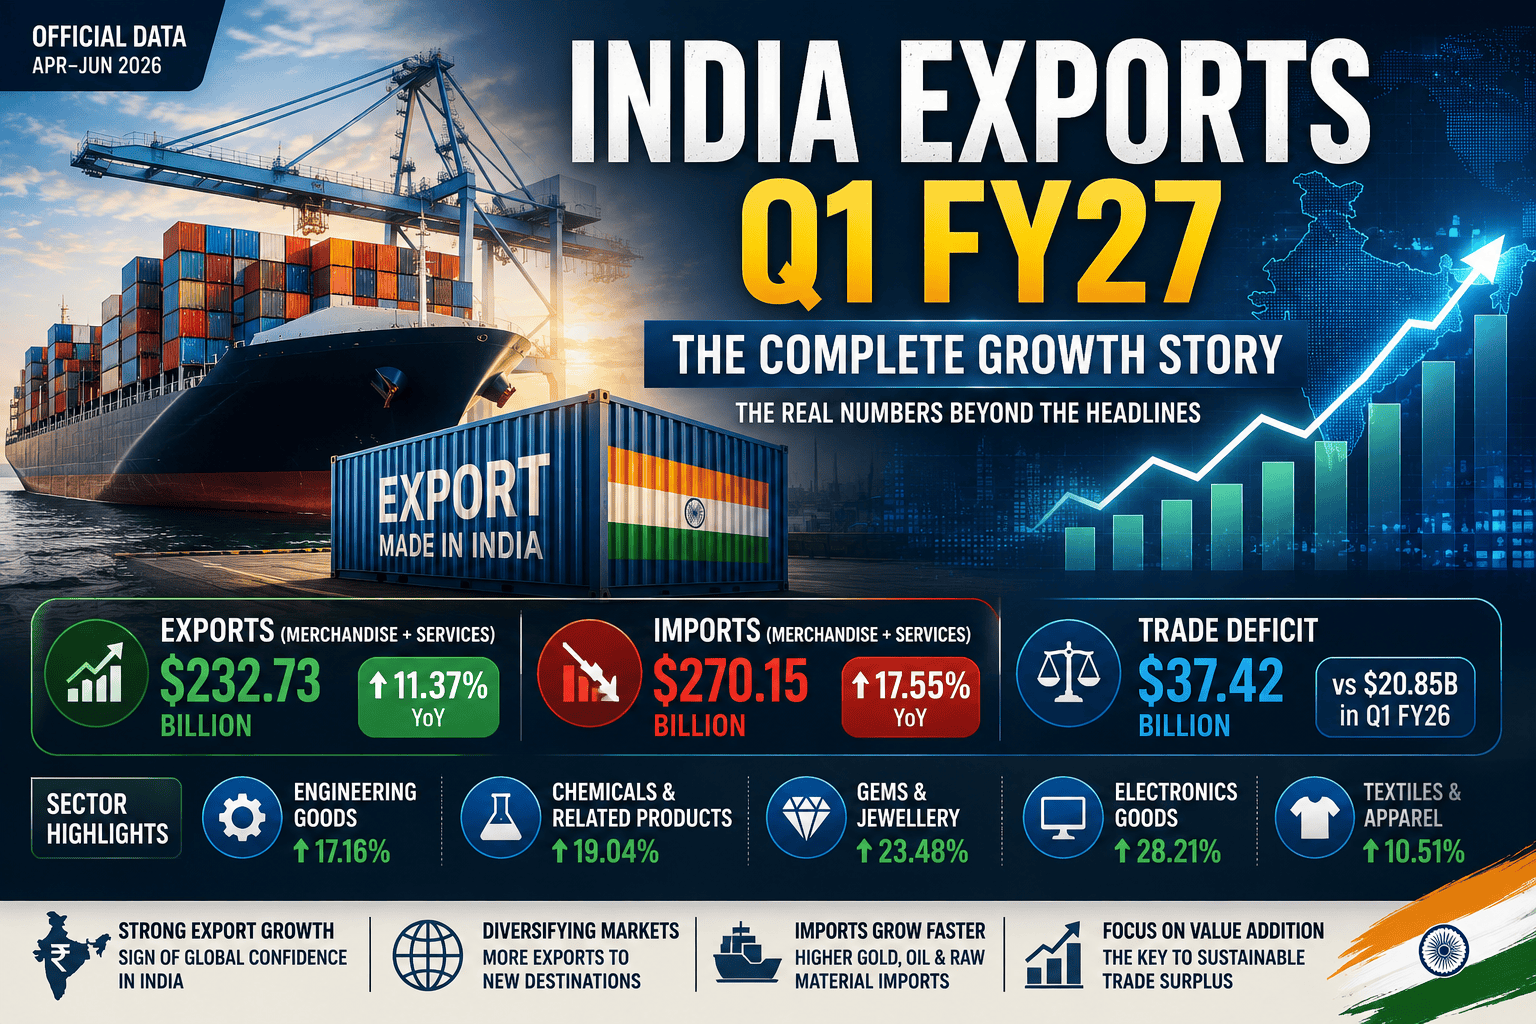
India Exports Q1 FY27 data, released by the Commerce Ministry on 13 July 2026, tells a genuinely good news story — up to a point. Total exports, combining merchandise and services, reached $232.73 billion for the April-June quarter, up 11.37% year-on-year. Merchandise exports specifically jumped 15.92% to $129.32 billion. Non-petroleum exports — a useful measure of underlying industrial and manufacturing strength, stripped of oil-price noise — grew 12.44% to $106.30 billion, suggesting the growth isn't just a story about expensive commodities getting more expensive.
This data arrives at a genuinely interesting moment for India's external sector story. It lands just two days before the India-UK trade deal entered into force, right in the middle of the aftermath from this year's oil price shock and subsequent collapse, and during a quarter when precious metals prices moved more dramatically than at almost any point in recent memory. Untangling how much of the India Exports Q1 FY27 headline number reflects each of these separate forces — genuine demand growth, currency and pricing effects, and one-off timing dynamics — is exactly what the rest of this piece sets out to do.
Here's what most of the coverage led with the headline number and stopped there. Imports over the same quarter grew even faster — 17.55%, to $270.15 billion — which meant the combined trade deficit nearly doubled to $37.42 billion, up from $20.85 billion in the same quarter last year. Both things are true simultaneously: India's exporters are genuinely having a strong quarter, and India's external trade balance is getting meaningfully worse, not better. This piece covers both halves properly.
The Headline Numbers Behind India Exports Q1 FY27
| Metric | Q1 FY27 (Apr-Jun 2026) | Q1 FY26 (Apr-Jun 2025) | Change |
|---|---|---|---|
| Total Exports (Goods + Services) | $232.73B | $208.98B | +11.37% |
| Merchandise Exports | $129.32B | $111.57B | +15.92% |
| Non-Petroleum Exports | $106.30B | $94.54B | +12.44% |
| Total Imports | $270.15B | — | +17.55% |
| Services Exports (est.) | $103.41B | $97.41B | +6.16% |
| Services Trade Surplus | $49.43B | $47.90B | +3.19% |
| Combined Trade Deficit | $37.42B | $20.85B | Widened 79.5% |
The merchandise-specific trade deficit alone — goods only, before services are netted in — stood at $86.86 billion for the quarter, up from $68.75 billion a year earlier. Services trade continues doing the heavy lifting it usually does for India's external balance, running a healthy $49.43 billion surplus that partially offsets the much larger goods deficit, but even that surplus grew more slowly (3.19%) than the overall picture would suggest is needed to keep pace.
Sector by Sector: What's Actually Driving the 15.92% Growth
What's notable across this list is the absence of any single dominant driver — this isn't a story about one commodity price spike distorting the picture (the way, say, a gold price surge alone might inflate a gems export number without reflecting real demand growth). Engineering goods and chemicals, in particular, are volume-and-manufacturing-driven categories rather than pure price-pass-through categories, which is a genuinely encouraging signal about underlying industrial capacity rather than just favourable commodity pricing.
Four sectors, four different growth stories, one broadly positive quarter.
Where This Fits in India's Longer Export Trajectory
A single quarter's numbers land with more meaning when placed against the broader trend they're part of. India's merchandise exports have been on a gradually rising trajectory over the past several years, supported by a combination of Production-Linked Incentive (PLI) schemes targeting electronics, pharmaceuticals, and specialty chemicals manufacturing, a series of new free trade agreements reducing tariff barriers in key destination markets, and a deliberate government push toward geographic diversification away from over-reliance on any single major trading partner.
The 15.92% growth rate recorded this quarter sits well above the more modest, single-digit growth rates India's merchandise exports posted through much of the preceding two years, when global demand was softer and commodity price volatility made quarter-to-quarter comparisons genuinely difficult to interpret. Whether Q1 FY27 represents a genuine structural acceleration — the PLI schemes and trade agreements finally showing up meaningfully in the topline numbers — or a temporarily flattering quarter boosted by precious metals pricing and pent-up restocking demand is precisely the question the next two quarters of data will help answer.
It's also worth noting that India's Q1 FY27 falls in a period when several of its regional trade competitors have faced their own headwinds. Vietnam and Bangladesh, both significant textile and manufacturing export competitors to India, have navigated their own tariff negotiations with major Western economies over the same period, while China's broader manufacturing export base has continued facing scrutiny and diversification pressure from Western buyers looking to reduce single-country supply chain concentration. To whatever extent Indian exporters are capturing market share that might otherwise have gone to these competitors, that dynamic would show up as exactly the kind of broad-based, multi-sector growth visible in this quarter's data, rather than a spike concentrated in one narrow category.
The Part Most Headlines Skipped: Why the Deficit Widened Faster
India Exports Q1 FY27 coverage overwhelmingly led with the 15.92% merchandise growth figure — genuinely the more exciting, positive-sounding number. Buried further down, if mentioned at all, was the fact that imports grew even faster at 17.55%, pushing the combined trade deficit from $20.85 billion to $37.42 billion — a jump of nearly 80% year-on-year.
The honest framing here is that "exports grew 16%" and "the trade balance deteriorated" are not contradictory facts — they're simply two different measurements of the same underlying quarter, and a genuinely balanced assessment needs both. Faster-growing imports could reflect several different underlying stories: businesses restocking inventory after the West Asia oil supply disruption earlier in the year, elevated gold and silver import volumes given this year's precious-metals price surge, or simply robust domestic demand pulling in more foreign goods as India's own consumption grows. Distinguishing between these explanations matters enormously for how worried to be about the trend — restocking normalises; structurally rising import dependence doesn't.
June Alone: A Closer Look at the Monthly Spike
Zooming into June 2026 specifically sharpens the picture considerably. Monthly exports for June came in at $73.45 billion, up a solid 9.48% year-on-year. But monthly imports for the same month surged 26.85% to $88.76 billion — nearly three times the export growth rate — producing a June trade deficit of $15.32 billion, dramatically wider than the mere $2.89 billion deficit recorded in June 2025.
| Metric | June 2026 | June 2025 | Change |
|---|---|---|---|
| Exports | $73.45B | ~$67.09B | +9.48% |
| Imports | $88.76B | ~$69.98B | +26.85% |
| Trade Deficit | $15.32B | $2.89B | Widened over 5x |
That June-specific import surge is the real story hiding inside the quarterly headline. A jump of this magnitude in a single month is far more consistent with a restocking or catch-up dynamic — businesses and traders replenishing inventory that had been drawn down or delayed during the earlier oil supply disruption, plus a genuine surge in precious metals import value given how sharply gold and silver prices moved this year — than with a slow-building structural trend. Whether June proves to be a one-off spike or the start of a new pattern will only become clear with the July and August data.
June's import spike is the single biggest swing factor behind the widened quarterly deficit.
Where India Exports Q1 FY27 Growth Is Actually Going
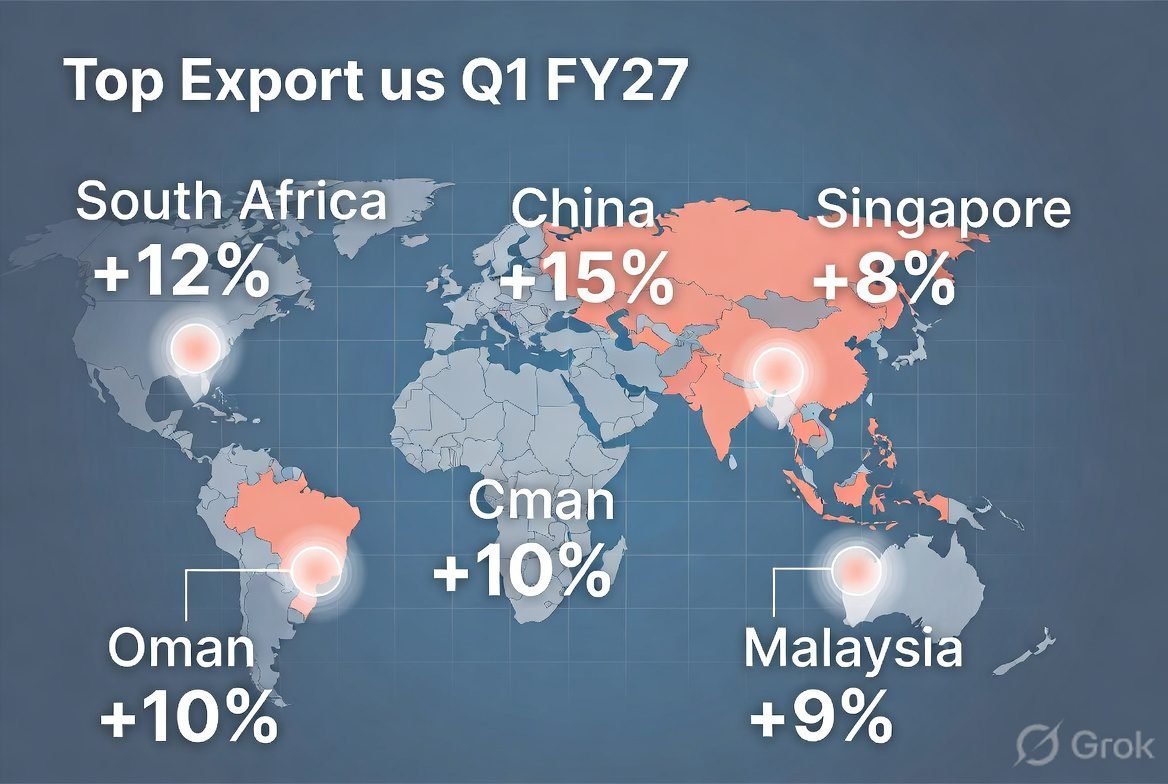
Geographic patterns in the data add useful colour beyond the headline sector numbers. Export growth was particularly strong to South Africa, Singapore, China, Oman, and Malaysia during the quarter — a genuinely diverse mix spanning Africa, Southeast Asia, East Asia, and the Gulf, rather than concentration in any single traditional market like the US or EU. That diversification is broadly healthy from a risk-management perspective: it means India's export growth isn't hostage to demand conditions in any one major economy.
Where the Import Surge Is Coming From
On the import side, the strongest growth came from Russia, China, the United States, the UAE, and Taiwan. Russia's presence at the top of that list is consistent with India's well-documented, sharply increased crude oil purchases from Russian sources over the past couple of years — a pattern that itself interacts directly with the broader oil price story covered in our Oil Price Crash 2026 explainer. China and Taiwan's presence likely reflects electronics, machinery, and semiconductor-adjacent component imports feeding India's own manufacturing and assembly operations — inputs, in other words, that eventually flow back out as some of the very engineering and electronics exports driving the growth story on the other side of the ledger.
Services: The Quiet, Reliable Surplus Engine
While merchandise trade grabbed the headlines, India's services exports continued their familiar, steadier role — estimated at $103.41 billion for the quarter against $53.97 billion in services imports, producing a robust $49.43 billion surplus. This surplus has been the structural offset to India's persistent goods trade deficit for years now, and it grew modestly (3.19%) even as the headline merchandise numbers moved much more dramatically in both directions. IT services, business process outsourcing, and professional services continue underpinning this surplus — a reminder that India's external account resilience still leans heavily on the same services sector currently navigating its own AI-disruption questions, covered in our AI Investing 2026 guide and Infosys Q1 FY27 preview.
Connecting the Dots: CETA, Gold, and the Gems Story
Several threads from recent economic news connect directly into this export data, and it's worth being explicit about the links rather than treating each story in isolation.
The India-UK Comprehensive Economic and Trade Agreement, which entered into force on 15 July, offers zero-duty UK market access specifically to textiles, gems & jewellery, engineering goods, leather, and marine products — several of the exact categories already showing the strongest growth in this Q1 FY27 data, even before the deal's effects have had time to fully show up. If anything, this quarter's numbers represent the baseline against which CETA's actual incremental impact will need to be measured in the coming quarters.
The gems & jewellery sector's standout 34.64% growth also needs to be read alongside the precious metals price story covered in our Silver Price Surge 2026 and Gold Price Prediction Diwali 2026 articles. When gold and silver prices rise sharply, as they have this year, the dollar value of jewellery exports rises too, even without a proportional increase in physical volume — a nuance worth keeping in mind before crediting the entire 34.64% figure purely to demand growth rather than partly to price effects.
The Forecast That Undershot by a Mile
Here's a detail that puts the actual outcome in useful perspective: as recently as 13 May 2026, the government-backed Export-Import Bank of India projected total merchandise exports for this exact quarter at just $111.9-112 billion, with non-oil exports at $97.8 billion — describing the expected growth as merely "marginal." The actual outcome, $129.32 billion, came in roughly $17 billion above that forecast, a genuinely large miss for an institutional model built specifically to track and predict quarterly export performance.
What This Means for the Rupee and RBI
A widening trade deficit, even one accompanied by strong export growth, typically means greater demand for foreign currency to settle India's external accounts — a headwind for the rupee, all else being equal. This interacts directly with the broader currency and inflation picture covered in our RBI Repo Rate Cut guide: a wider deficit works in the opposite direction of the relief India's external position has been getting from this year's oil price collapse, meaning the two forces are currently working against each other rather than reinforcing a single clear trend for the rupee.
For the RBI specifically, both the strength of underlying export growth and the composition of the import surge (temporary restocking versus structural demand) will factor into how the central bank reads the overall external sector picture at its upcoming policy review, alongside the inflation and oil-price dynamics already in play.
Is India Exports Q1 FY27 Growth Sustainable?
Several open questions determine whether Q1 FY27's export strength continues or proves to be a temporary quarter. First, how much of the gems & jewellery growth is price-driven versus volume-driven — if gold and silver prices correct meaningfully, as they've shown they can do sharply this year, the dollar-value export growth in that category could reverse even if physical demand holds steady. Second, whether the June import spike specifically was a genuine one-off restocking event or the start of a more structural pattern of rising import dependence. Third, how quickly CETA's actual incremental trade effects — as opposed to baseline growth that would have happened anyway — become visible and measurable in the coming quarters' data.
A fourth factor worth watching sits outside India's control entirely: the durability of the current global trade environment itself. Tariff negotiations between major economies remain an active, evolving process rather than a settled backdrop, and any renewed escalation in trade tensions between the US, China, or other major blocs could shift the competitive dynamics that appear to be favouring Indian exporters this quarter. Currency movements matter too — a meaningfully stronger rupee would make Indian exports less price-competitive even if underlying demand for the goods themselves stayed constant, a dynamic directly connected to the rupee trajectory discussed in the section above.
What This Means at the Company Level
Aggregate trade data is useful for understanding the macro picture, but it's worth translating into what it plausibly means for specific listed businesses, since that's ultimately where the growth shows up for investors. In gems and jewellery, export-oriented players with established international distribution — companies supplying cut diamonds and finished jewellery to markets like the UAE, the US, and increasingly the UK following CETA — are the most direct beneficiaries of both the price-driven and volume-driven components of this quarter's 34.64% growth figure.
In engineering goods, the beneficiary base is broader and less concentrated in a handful of obvious names — auto component manufacturers, industrial machinery producers, and capital goods companies with meaningful export order books all plausibly captured some part of the 20.74% sectoral growth. The specific companies that will show this most clearly in their own quarterly results are those where export revenue makes up a large share of the total top line, rather than companies that are primarily domestic-facing with only incidental export exposure.
Chemicals exporters, similarly, span a range from bulk commodity chemical producers to specialty and fine chemical manufacturers serving pharmaceutical and agrochemical supply chains globally — the latter group typically commands better margins and is less exposed to the kind of price volatility that affects bulk chemical pricing. Investors specifically interested in this sector's export story should distinguish between these two sub-categories rather than treating "chemicals" as a single undifferentiated basket.
What India Exports Q1 FY27 Data Means for Investors
For investors tracking export-linked sectors specifically, this data offers genuine, broad-based confirmation of strength across gems & jewellery, engineering goods, and chemicals — sectors already flagged in our CETA coverage as direct beneficiaries of the new UK market access. The honest caveat is that a single quarter's data, especially one that beat institutional forecasts by such a wide margin, deserves at least one more quarter of confirmation before treating the growth rate as a reliable new baseline rather than a possibly front-loaded or price-inflated one-off. Diversified exposure to export-oriented sectors, rather than concentrated bets on the single best-performing category, remains the more defensible approach given how much of this quarter's headline number may reflect precious-metals pricing specifically.

The Bottom Line on India Exports Q1 FY27
India Exports Q1 FY27 is a genuinely good news story on the export side — broad-based, double-digit growth across manufacturing-heavy categories, comfortably beating institutional forecasts, and arriving just as the India-UK trade deal opens further doors in several of the same sectors. But the complete picture, honestly told, includes an import bill that grew even faster and a trade deficit that nearly doubled — a detail that matters for the rupee, the current account, and anyone assuming "exports up 16%" automatically means India's external position improved this quarter. It didn't, not on a net basis. Both halves of the story are true, and both are worth tracking into the next quarter's release.
FAQs: India Exports Q1 FY27
Total exports (merchandise and services) grew 11.37% year-on-year to $232.73 billion. Merchandise exports specifically grew 15.92% to $129.32 billion.
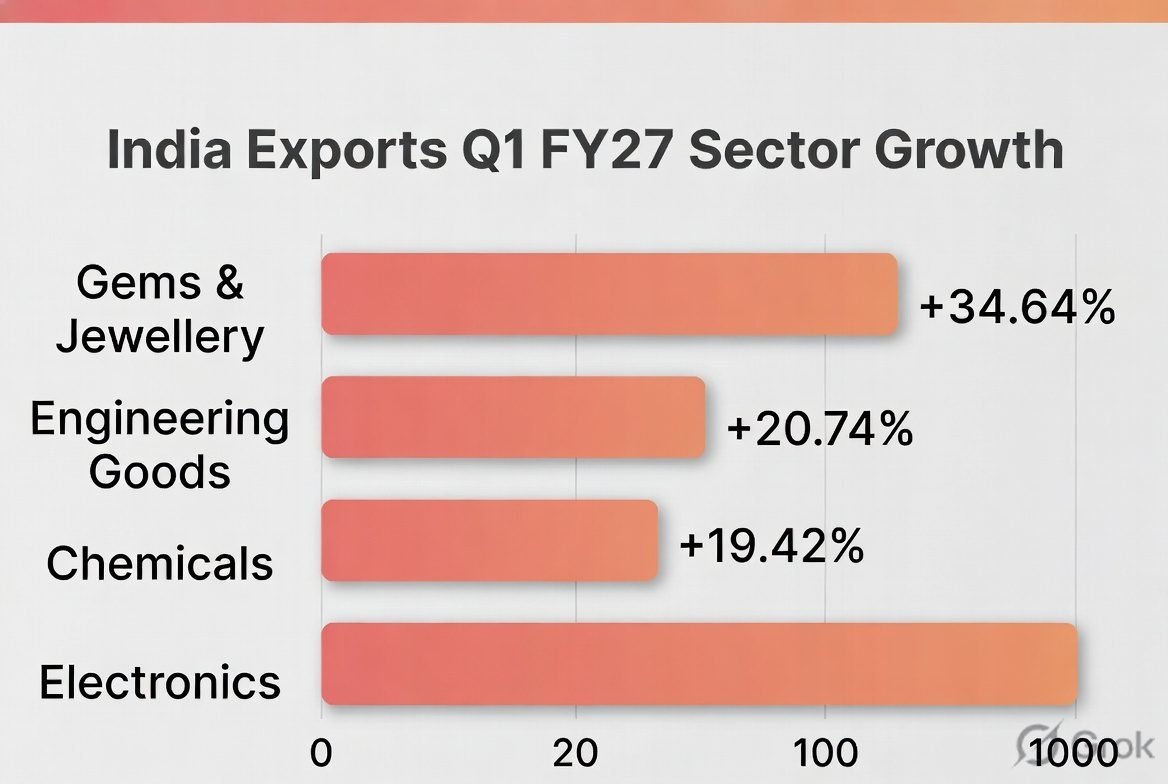
Gems and jewellery led with 34.64% growth, followed by engineering goods at 20.74%, organic and inorganic chemicals at 19.42%, and strong growth in electronics.
It worsened. The combined merchandise and services trade deficit widened to $37.42 billion from $20.85 billion a year earlier, as imports grew faster (17.55%) than exports (15.92% for merchandise).
Likely factors include restocking after the earlier West Asia oil supply disruption, elevated gold and silver import values given this year's precious metals price surge, and robust domestic demand. June alone saw imports surge 26.85% year-on-year.
CETA offers zero-duty UK access to gems and jewellery, engineering goods, textiles, leather, and marine products — several of the same categories already showing strong growth in this data, meaning the deal's actual incremental impact will need to be measured against this quarter's baseline in coming quarters.
No. The Export-Import Bank of India's May 2026 forecast had projected merchandise exports of only $111.9-112 billion with "marginal" growth — the actual $129.32 billion outcome beat that forecast by roughly $17 billion.
South Africa, Singapore, China, Oman, and Malaysia showed particularly strong export growth during the quarter, reflecting geographic diversification beyond traditional US and EU markets.
References: BizzBuzz: Engineering, Gems Power Export Growth · Republic World: Exports Grow, Trade Deficit Widens · BW Businessworld: Q1 Exports Rise on Merchandise Growth · New Kerala: Total Exports Surge 11.37% · Blitz India: Exim Bank Q1 FY27 Forecast (May 2026)

Pranab Barman is a Financial Educator and Personal Finance Researcher with over 10 years of hands-on experience in stock markets, trading, and investing. Currently enrolled in the CFA Program, he is committed to continuous learning and professional excellence in finance.
As the Founder of PlayWithStock, Pranab covers a wide range of topics including Mutual Funds, SIP, Taxation, Stock Market Basics, and Financial Calculators — with a focus on simplifying complex financial concepts for everyday all investors.
Email: support@playwithstock.com
Website: playwithstock.com
Related posts:
 Bank of Maharashtra Q1 FY27 Results: QIP Update, Business Growth & Preview
 SK Hynix ADR Premium 2026: The Ajab Arbitrage Story Everyone’s Watching
 What is the Dollar Index (DXY) and Why It Matters for India
 Monsoon 2026 India Inflation: Why a Dry June Hits Grocery Bills
 India US Trade Deal 2026: Inside the Tariff Rollercoaster Before July 22
 India UK Trade Deal 2026: What Gets Cheaper, and Which Stocks Just Won
 Oil Price Crash 2026: How the End of a War Is Reshaping India’s Economy
 AI Investing 2026: The Complete India-US Stock Guide