


Today Nifty India Market Outlook: Oil, Rupee, VIX and FII Selling Explained
Today Nifty India Market Outlook genuinely has more moving parts than a normal morning — six separate pressures are stacking up on the same session, and we'd rather walk you through each one individually than leave you with a vague "markets are cautious" summary. Crude oil is climbing, the rupee is sliding, volatility is creeping up, both foreign and domestic institutions have been selling, and two entire sectors are under pressure — while, oddly enough, global AI stocks are having a genuinely strong week. None of these threads are new on their own, but seeing them together is what actually explains today's mood. Live index levels and sector-wise data can always be verified directly on NSE's live market data page.
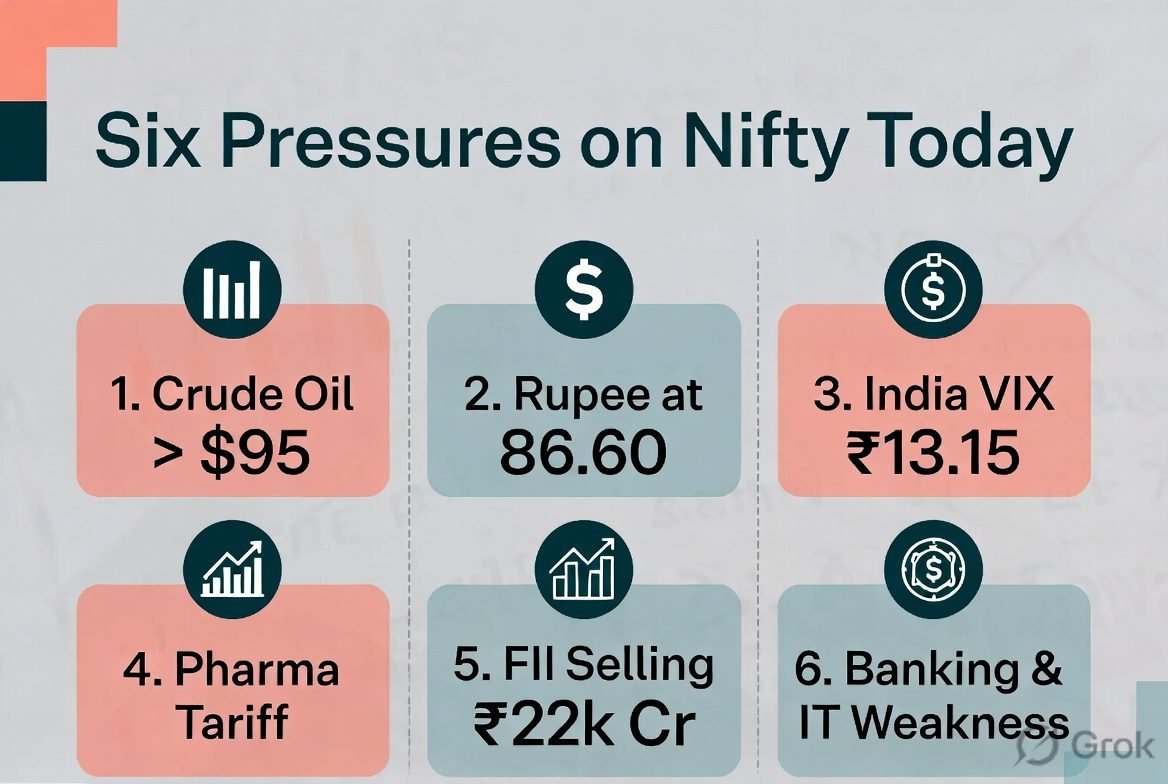
Table of Contents
- The Six Pressures on Today's Session
- 1. Crude Oil Keeps Climbing
- 2. The Rupee Hits a Monthly Low
- 3. India VIX — What "Near 13-14" Actually Means
- 4. The Pharma Tariff Overhang
- 5. Both FIIs and DIIs Selling — A Rare Combination
- 6. Banking and IT Both Under Pressure
- The Odd One Out: Global AI Stocks Are Rallying
- What to Watch Through Today's Session
- Frequently Asked Questions
The Six Pressures on Today's Session
Today's Market Snapshot — July 23, 2026
| USD/INR | ~86.60 (monthly high) |
| India VIX | ~13.15 |
| Crude Oil (Brent) | $95+/barrel |
| FII Selling (July, MTD) | ₹22,185.90 crore |
| Sectors Under Pressure | Banking, IT, Auto, Oil & Gas |
| Global AI Stocks | Higher, ahead of Big Tech earnings |
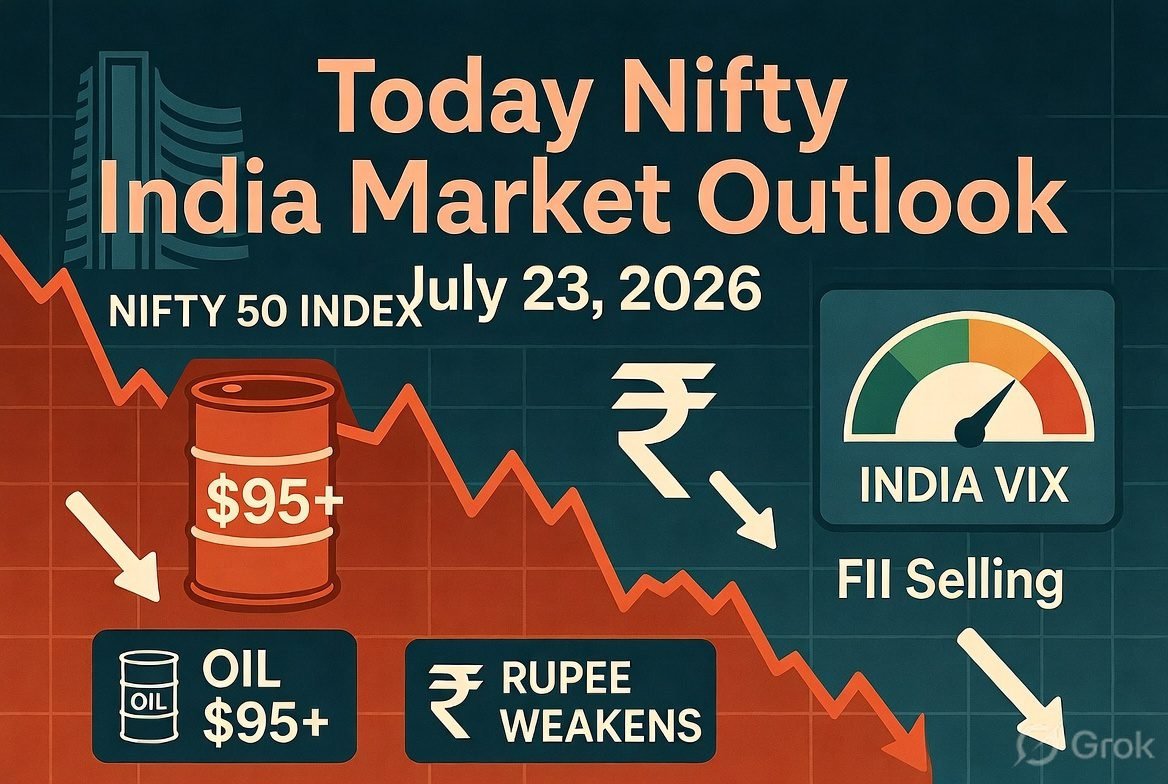
We're not going to pretend these six things are unrelated — most of them are actually the same underlying story wearing different clothes. West Asia tension is pushing oil higher, which weakens the rupee, which spooks foreign investors, which shows up as FII selling, which nudges India VIX up, which then hits rate-sensitive sectors like banking hardest. It's genuinely one chain reaction more than six separate problems, and understanding that chain is more useful than memorizing six isolated numbers.
It's worth being honest about scale here too. None of today's individual numbers are extreme by historical standards — oil above $95 is elevated but not at crisis levels seen during past major disruptions, the rupee's move is measured in single-digit percentage terms rather than a currency crisis, and VIX near 13 remains well below genuinely panicked readings. What makes today worth writing about isn't any single number being extreme; it's that six identifiable pressures are compounding in the same direction at the same time, which tends to produce a more persistently cautious mood than any one factor alone would.
1. Crude Oil Keeps Climbing
Crude oil trading above $95 a barrel is the root cause sitting underneath several of today's other pressures. West Asia tensions are a near-term headwind for the Nifty 50, mainly through higher crude oil, a weaker rupee, and risk-off foreign investor behavior — a pattern we've been tracking closely since it first showed up in our Sensex Nifty Crash July 2026 coverage earlier this week.
For an economy that imports the vast majority of its crude needs, this isn't just a market-sentiment story — it flows almost mechanically into a higher import bill, more pressure on the rupee, and eventually into inflation the RBI has to weigh. We've unpacked this exact mechanism in our oil price and India impact article, and the geopolitical root cause connects directly to the US-Iran tension and Strait of Hormuz stories we've covered separately. Live crude prices can be tracked through OilPrice.com's crude charts.
2. The Rupee Hits a Monthly Low
The Indian Rupee extended its losing streak for a fifth straight trading day, with USD/INR jumping to near 86.60, the highest level seen in a month — even as the US Dollar Index itself traded near a two-week low around 97.40. That last detail is genuinely the more telling one: the rupee is weakening even while the dollar underperforms its G7 peers, which points to India-specific selling pressure rather than a simple "strong dollar" story.
Relentless FII selling in Indian equities is being driven by moderate growth in India Inc.'s quarterly earnings and ambiguity over global trade flow, with the US's August 1 tariff deadline looming large. We've tracked this rupee weakness building through our rupee vs dollar July 2026 article and the underlying mechanics in our Dollar Index (DXY) explained piece.
3. India VIX — What "Near 13-14" Actually Means
India VIX opened today near 12.88 and has ranged between roughly 12.81 and 13.35, with the live level sitting around 13.15 — still meaningfully below the kind of readings that signal genuine panic. A high India VIX, generally above 20-25, indicates traders expect significant price swings, typically associated with uncertainty or major events — markets often fall when VIX rises sharply.
India VIX is calculated by the NSE based on Nifty 50 options pricing and reflects expected volatility over the next 30 days — it's often called the market's "fear gauge." Major drivers of India VIX include RBI monetary policy, FII/DII flows, quarterly corporate earnings, global cues from US markets, and crude oil movements. Live VIX data can be tracked on NSE's official India VIX page and Investing.com's India VIX tracker.
4. The Pharma Tariff Overhang
This is a genuinely specific, scheduled risk rather than vague sentiment. Trump's announced generic drug tariff schedule — 0% starting August 1, 2026, rising to 100% after two years, and 200% after that — continues to weigh on pharma sentiment, since India is one of the world's largest suppliers of generic drugs to the US market. We covered the exact tariff schedule and its market reaction in detail in our Sensex Nifty Crash July 2026 article and our dedicated US generic drug tariff and pharma stocks piece.
What makes this particular overhang tricky to price is the staggered timeline — a 0% tariff today doesn't hurt anyone immediately, but pharma companies plan manufacturing and pricing on multi-year horizons, so the market has to start discounting the 100% and 200% phases years in advance. That's part of why pharma names have continued trading weak even though the actual high tariffs remain roughly two years away. Official tariff notices, once formally published, can be verified through the Office of the US Trade Representative, and Indian pharma export data is tracked by the Pharmaceuticals Export Promotion Council of India.
5. Both FIIs and DIIs Selling — A Rare Combination
| Metric | Figure |
|---|---|
| FII Selling, July MTD | ₹22,185.90 crore |
| FII Cash Activity, July 20 | -₹1,121 crore (net sellers) |
| DII Cash Activity, July 20 | +₹1,312 crore (net buyers) |
| Prior Session FII Activity | +₹1,650 crore (net buyers) |
| Prior Session DII Activity | -₹657 crore (net sellers) |
Here's where the picture gets genuinely nuanced rather than simply "everyone is selling." FII buying of ₹1,650.20 crore in one recent session offered a positive signal, though DII selling of ₹656.90 crore in that same session indicated some profit booking — while on other days the roles flip, with FIIs net sellers of ₹1,121 crore and DIIs net buyers of ₹1,312 crore. Day-to-day, institutional flows have genuinely been swapping sides.
Zoom out to the full month, though, and the FII trend is unambiguous: FIIs have sold ₹22,185.90 crore worth of Indian equities so far in July, continuing a pattern we flagged at ₹2.6 lakh crore for the full year in our recent crash coverage. This is exactly the dynamic we unpack in our FII vs DII explained article — single-session flows and the underlying monthly trend often tell different stories, and it's the trend that matters more for understanding market direction. Live daily FII/DII data is published on NSE's official FII/DII activity page and tracked by aggregators like Trendlyne's FII/DII data page.
6. Banking and IT Both Under Pressure
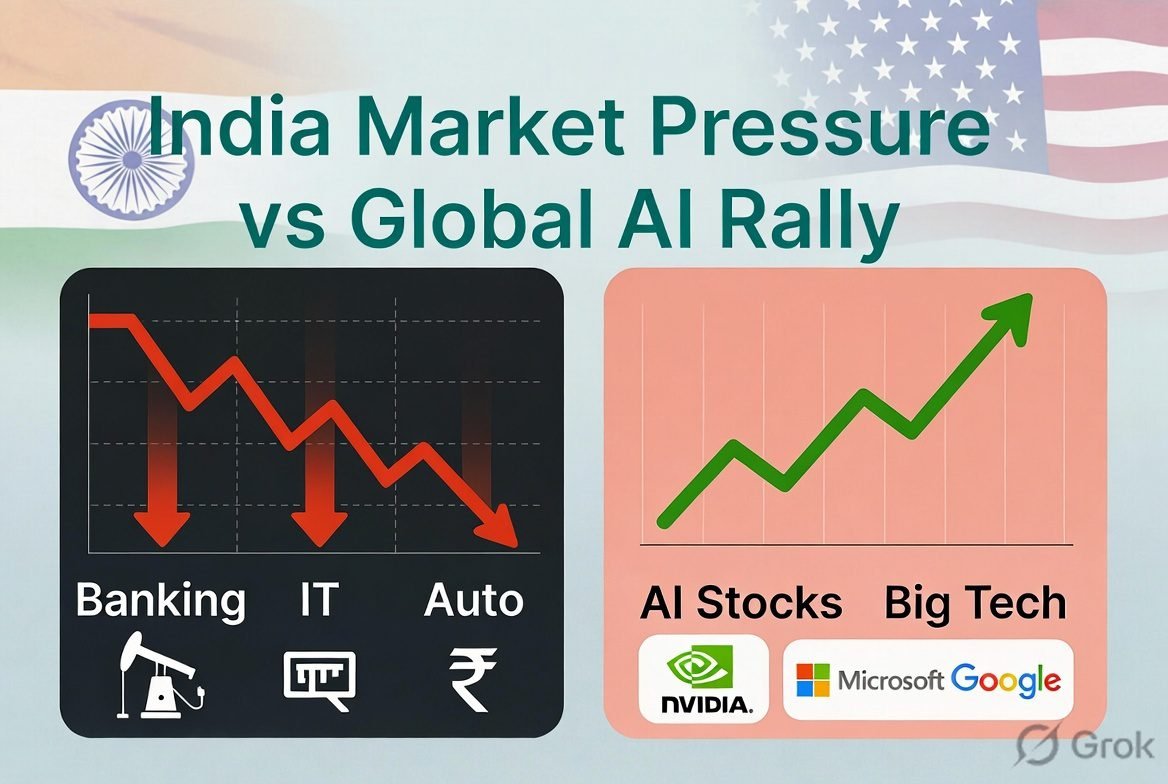
Indian equities closed lower recently as losses in the Banking, Auto, and Oil & Gas sectors led the market down, with earlier sessions also showing weakness concentrated in Real Estate, Auto, and Banking. Banking's sensitivity here connects directly to two of today's other pressures — rising oil costs feed inflation expectations, which affects rate-cut hopes ahead of the RBI's August 3-5 MPC meeting, and PSU banks in particular tend to react sharply to any shift in that outlook.
IT's weakness ties back to a different thread — a weaker rupee is normally a tailwind for IT exporters since their revenue is dollar-denominated, but broader risk-off sentiment and US-tariff uncertainty have been offsetting that usual relationship this week. If you're tracking specific banking names through this earnings season, our HDFC, ICICI, Axis and Kotak Bank Q1 results coverage and the Q1 FY27 earnings calendar are useful companions to today's sector-level picture.
It's worth noting that "sector under pressure" doesn't mean every single stock within it is falling equally — broad sector indices can mask genuine dispersion at the individual stock level, where company-specific earnings, guidance, and balance sheet strength still matter enormously even during a macro-driven down day. A well-capitalized private bank reporting strong Q1 numbers can still hold up relatively better than a PSU bank facing the same macro headwinds, even though both technically sit in the same "banking" bucket that today's sector data groups together.
The Odd One Out: Global AI Stocks Are Rallying
Here's the genuinely interesting divergence in today's picture. While Indian markets deal with oil, rupee, and institutional selling pressure, global AI-linked names have been trading firm heading into this week's Big Tech Earnings Week, with Alphabet, Tesla, and IBM all reporting and semiconductor stocks leading gains on optimism around AI capital expenditure paying off.
This split matters because it shows today's India-specific weakness isn't part of a broader global risk-off collapse — it's a more targeted combination of India-specific factors (rupee, FII flows, pharma tariff) layered on top of a genuinely global oil-driven headwind. Global markets rallying on AI optimism at the same time India deals with its own specific pressures is actually a reasonably common pattern, not a contradiction. If you're comparing AI-linked opportunities across both markets, our best AI stocks India 2026 and AI investing guide covering both US and India connect directly to this divergence.
Understand This Better: What Is Sector Rotation →What to Watch Through Today's Session
Watch: Crude Oil Direction
If oil eases back from $95, expect the rupee and banking sentiment to stabilize somewhat in tandem — they're the most tightly linked pair in today's picture.
Watch: FII Cash Flow Reversal
A single day of FII buying doesn't undo the month's ₹22,185 crore selling trend — watch for at least 2-3 consecutive buying sessions before reading it as a genuine shift.
Watch: VIX Crossing 15
Current levels near 13 are calm by historical standards; a sustained move above 15-16 would be the first real signal that volatility is genuinely picking up, not just drifting.
Watch: Big Tech Earnings Spillover
Strong US mega-cap results tonight could lift global risk appetite enough to offset some India-specific pressure tomorrow, even without any change in oil or rupee.
We're not going to tell you to make any dramatic portfolio moves off a single morning's combination of pressures. If you have a long-term SIP running, this is exactly the kind of week our behavioral mistakes in stock trading guide warns against reacting to emotionally — six identifiable, trackable pressures are a very different situation than genuine panic with no explainable cause.
If you're holding a diversified portfolio rather than concentrated bets on banking or IT specifically, today's combination of pressures is worth monitoring rather than reacting to. The genuinely useful exercise is checking your own specific exposure — if you're heavily weighted toward pharma exporters, rate-sensitive PSU banks, or rupee-sensitive sectors, today's news carries more direct relevance to your holdings than if your portfolio is spread across sectors that aren't currently in the crosshairs of any of these six pressures. A diversified index-based approach, the kind we discuss in our index funds vs active funds comparison, tends to smooth out exactly this kind of sector-concentrated pressure by design.
Frequently Asked Questions
Why is the Indian stock market under pressure today?
A combination of six factors: rising crude oil above $95/barrel, a weakening rupee near a monthly low of 86.60 against the dollar, India VIX creeping up, a scheduled US pharma tariff overhang, continued FII selling for the month, and weakness concentrated in banking and IT stocks.
What is India VIX today and what does it mean?
India VIX is trading around 13.15, which is on the calmer end of its 52-week range of 8.72 to 28.90. Levels above 20-25 typically signal genuine market fear; today's reading suggests moderate, not extreme, expected volatility.
Why is the rupee weakening against the dollar?
The rupee has extended its losing streak partly due to continued FII selling of Indian equities and rising crude oil prices, even as the US Dollar Index itself trades near a two-week low, suggesting India-specific pressure rather than simple dollar strength.
How much have FIIs sold in Indian markets this month?
FIIs have sold approximately ₹22,185.90 crore worth of Indian equities so far in July 2026, according to NSE data, even though individual daily sessions have sometimes shown net FII buying.
Why are banking and IT stocks both falling today?
Banking is sensitive to rising oil-driven inflation expectations ahead of the RBI's August MPC meeting, while IT stocks are seeing their usual rupee-weakness tailwind offset by broader risk-off sentiment and US tariff uncertainty.
Why are global AI stocks rising while Indian markets are under pressure?
Today's Indian market pressure stems mainly from India-specific and oil-driven factors, while global AI optimism ahead of Big Tech earnings reflects a separate, largely US-centric story — the two trends aren't contradictory, just driven by different underlying causes.
Our Bottom Line for Today
We'd rather you understand the actual chain connecting today's pressures — oil pushing the rupee down, the rupee and tariff uncertainty pushing FIIs to sell, and that selling showing up in banking and IT weakness — than just see a red day and assume something has gone structurally wrong. Every factor here is identifiable and trackable, which is a meaningfully different situation than an unexplained sell-off.
We'll keep updating our market outlook coverage as these six threads develop through the week — particularly whether oil holds above $95, whether the rupee stabilizes or slides further, and how tonight's Big Tech earnings from Alphabet, Tesla, and IBM feed into tomorrow's opening sentiment. Days with this many simultaneous, identifiable pressures tend to resolve one of two ways: either the pressures ease together as they're closely linked, or a specific trigger — a change in oil, a diplomatic development on the Iran front, or a surprise in tonight's earnings — shifts the whole picture at once.
If you're newer to reading days like this, our beginner investing guide and Nifty and Sensex explainer are useful starting points before making any reactive decision based on a single session's combination of pressures.

Pranab Barman is a Financial Educator and Personal Finance Researcher with over 10 years of hands-on experience in stock markets, trading, and investing. Currently enrolled in the CFA Program, he is committed to continuous learning and professional excellence in finance.
As the Founder of PlayWithStock, Pranab covers a wide range of topics including Mutual Funds, SIP, Taxation, Stock Market Basics, and Financial Calculators — with a focus on simplifying complex financial concepts for everyday all investors.
Email: support@playwithstock.com
Website: playwithstock.com
Related posts:
 Why Is the Stock Market Falling Today? US-Iran Tensions, Crude Oil Spike & FII Selling Explained
 Nifty July 2026: Will It Hit 24,800? Complete Market Outlook and Stock Guide
 Rupee vs Dollar July 2026: 5 Shocking Reasons the Rupee Is Falling
 Nifty July Seasonality: Why July Is Nifty’s Strongest Month (27-Year Data)
 FII vs DII: 7 Key Differences Every Indian Investor Should Know
 Sensex Nifty Crash July 2026: 3 Real Reasons Behind the Fall
 Oil Price Crash 2026: How the End of a War Is Reshaping India’s Economy
 India IPO Boom 2026: ₹2.65 Lakh Crore Pipeline Explained in Simple Terms